Fig. 10
Download original image
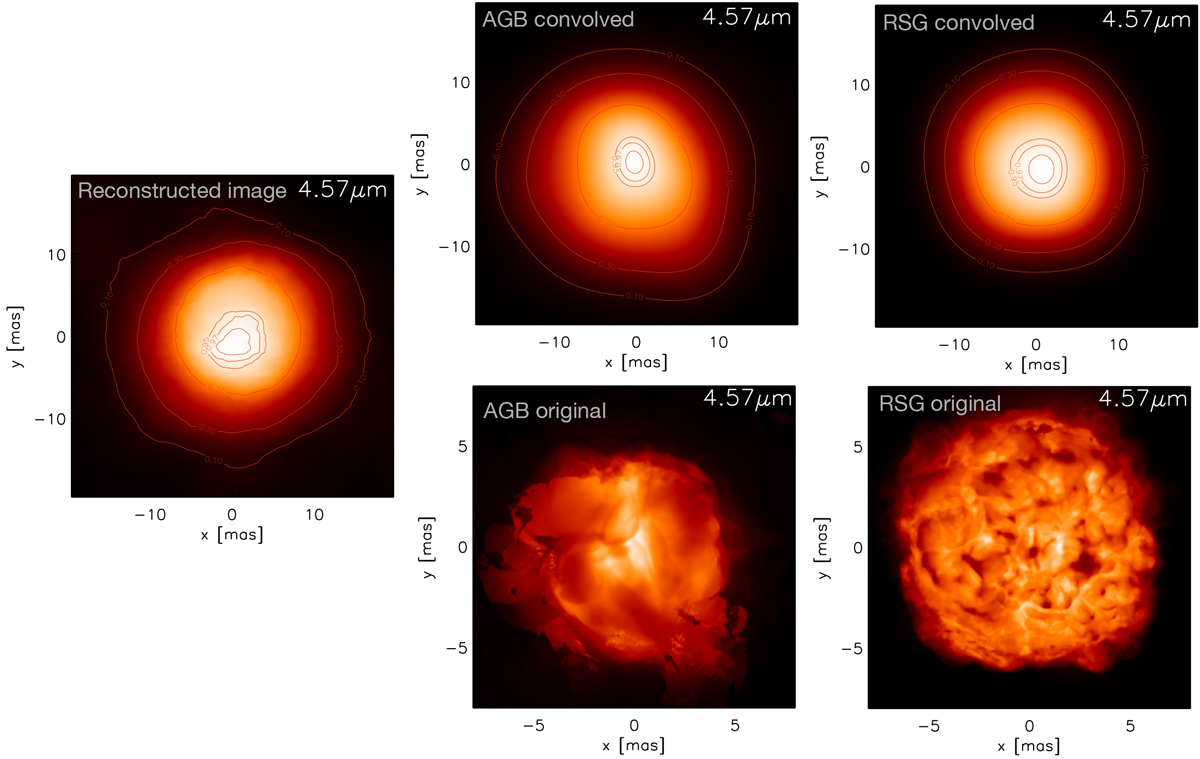
Top row: reconstructed image (left) and synthetic intensity maps computed for the best matching RHD simulations of Table 3 at 4.57 μm. The intensity is normalised between [0, 1]. The images, 256 × 256 pixels with 0.39 mas pixel−1, were convolved with the interferometric beam (Fig. 1). The contour lines are the same as in Fig. 4. East is left, while north is up. Bottom row: synthetic intensity maps from the above snapshots non-convolved with the interferometric beam. The peak intensity is normalised between [0, 1]. The RSG snapshot
![]() , while the AGB one is
, while the AGB one is ![]() .
.
Current usage metrics show cumulative count of Article Views (full-text article views including HTML views, PDF and ePub downloads, according to the available data) and Abstracts Views on Vision4Press platform.
Data correspond to usage on the plateform after 2015. The current usage metrics is available 48-96 hours after online publication and is updated daily on week days.
Initial download of the metrics may take a while.