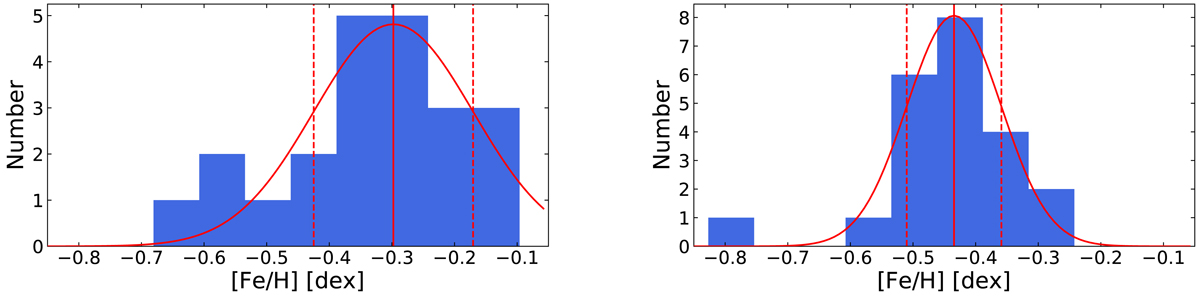
Fig. 9.
Download original image
Histograms of the iron abundance distributions of the sample of the 22 Cepheids in the Romaniello et al. (2008) sample. Left panel: original values from Romaniello et al. (2008, see their Table 9), together with the best fitting Gaussian (solid red curve). The vertical lines mark the position of the peak of the Gaussian (solid red) and plus and minus one Gaussian sigma (red dashed). Right panel: same as the left panel, but for our re-analysis of the same spectra. The distribution in the left panel was artificially broadened because of a spurious trend in [Fe/H] vs. vturb resulting from the abundance analysis (see Fig. 10 and the text).
Current usage metrics show cumulative count of Article Views (full-text article views including HTML views, PDF and ePub downloads, according to the available data) and Abstracts Views on Vision4Press platform.
Data correspond to usage on the plateform after 2015. The current usage metrics is available 48-96 hours after online publication and is updated daily on week days.
Initial download of the metrics may take a while.