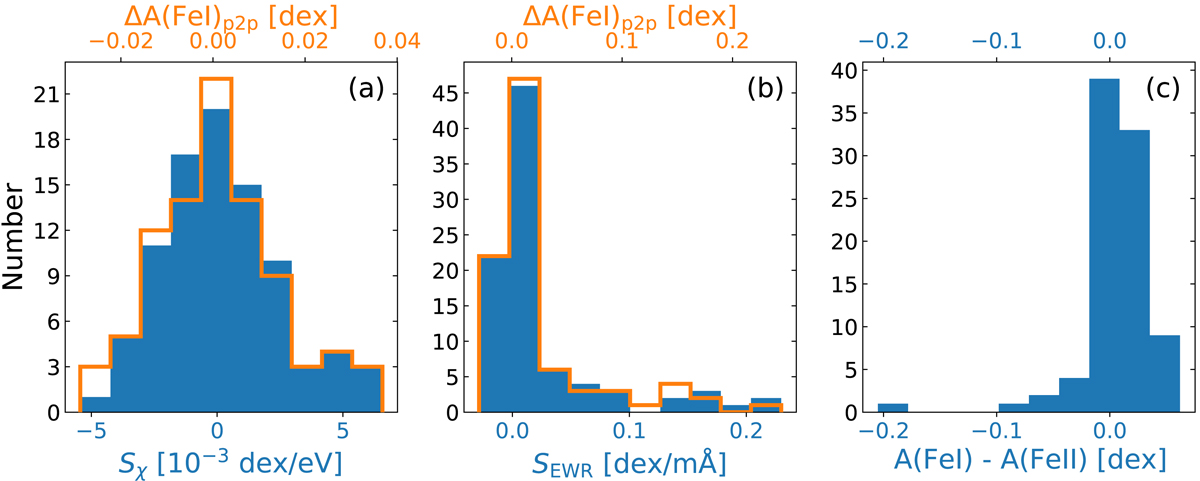
Fig. 4.
Download original image
Histograms of the output values of the diagnostics used to derive the stellar parameters for the 89 stars in our combined sample. Panel a: slope Sχ of FeI abundance vs. excitation potential χ used to derive the effective temperature Teff (solid blue curve, bottom x scale). The corresponding peak-to-peak values of the spread in iron abundance (ΔA(FeI)p2p, see Eq. (1)) are plotted as an open orange curve (top x scale). Panel b: slope SEWR of the relation between FeI abundance and reduced EW EWR = log(EW/λ), which ranges between −5.5 and −4.5, and is used to constrain the microturbulent velocity vturb (solid blue curve, bottom x scale). Also here, the corresponding peak-to-peak values of the spread in iron abundance (ΔA(FeI)p2p, see Eq. (1)) are plotted as an open orange curve (top x scale). Panel c: difference between FeI and FeII, the minimisation of which is used to determine the surface gravity log(g). The mean and standard deviation of the distribution are 0.007 and 0.033 dex, respectively, indicating excellent agreement between the derived FeI and FeII abundances, and hence gravity, with no appreciable systematic errors.
Current usage metrics show cumulative count of Article Views (full-text article views including HTML views, PDF and ePub downloads, according to the available data) and Abstracts Views on Vision4Press platform.
Data correspond to usage on the plateform after 2015. The current usage metrics is available 48-96 hours after online publication and is updated daily on week days.
Initial download of the metrics may take a while.