Fig. 10.
Download original image
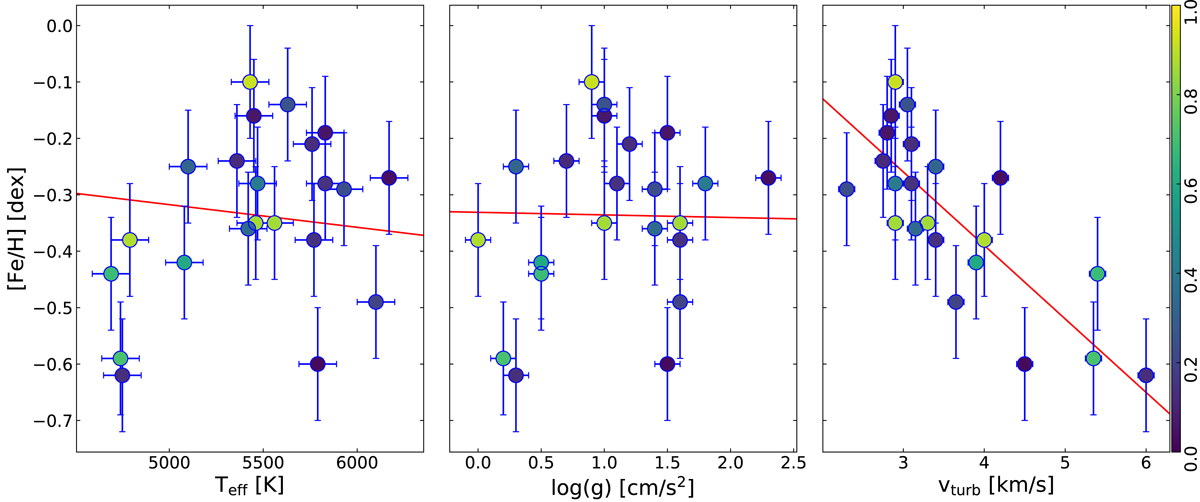
Measured iron abundance vs. stellar parameters as derived in Romaniello et al. (2008, see their Table 9), together with the results of a linear regression (red lines). A clear residual trend is present with vturb, which is responsible for the large scatter of σ = 0.13 that our analysis does not confirm. The points are colour-coded according to the phase along the pulsational cycle within which the stars were observed, with the scale represented by the bar on the far right.
Current usage metrics show cumulative count of Article Views (full-text article views including HTML views, PDF and ePub downloads, according to the available data) and Abstracts Views on Vision4Press platform.
Data correspond to usage on the plateform after 2015. The current usage metrics is available 48-96 hours after online publication and is updated daily on week days.
Initial download of the metrics may take a while.