Fig. 8

Download original image
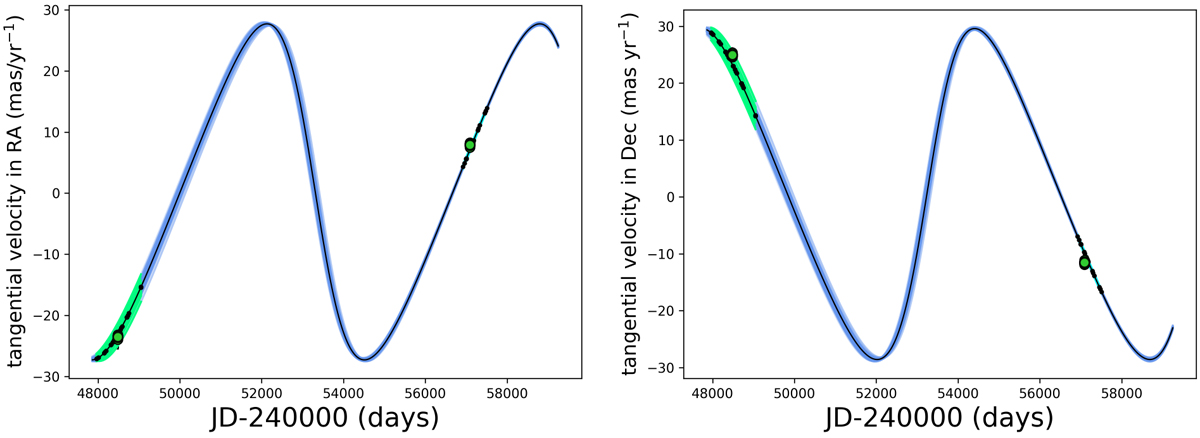
Model tangential velocity compared to HIPPARCOS and Gaia barycenter-corrected proper motion anomalies for HIP 36985AB. The tangential velocity in RA is plotted in the left panel, and the tangential velocity in Dec is plotted in the right panel. The best fit orbit from the direct imaging, RV, and the HIPPARCOS proper motion anomaly PT-MCMC run is plotted as a solid black line; blue lines depict 100 random orbits taken from the final converged PT-MCMC posterior pdf. HIPPARCOS and Gaia barycenter-corrected proper motion anomalies are plotted as green points for the same 100 random orbits; because the barycenter correction depends on primary and secondary mass, these vary slightly depending on the orbit selected. The HIPPARCOS mission lifetime for the 100 random orbits is highlighted in green; the Gaia DR2 observation period is highlighted in cyan. The small circle points depict the dates at which HIPPARCOS and Gaia measurements were acquired.
Current usage metrics show cumulative count of Article Views (full-text article views including HTML views, PDF and ePub downloads, according to the available data) and Abstracts Views on Vision4Press platform.
Data correspond to usage on the plateform after 2015. The current usage metrics is available 48-96 hours after online publication and is updated daily on week days.
Initial download of the metrics may take a while.


