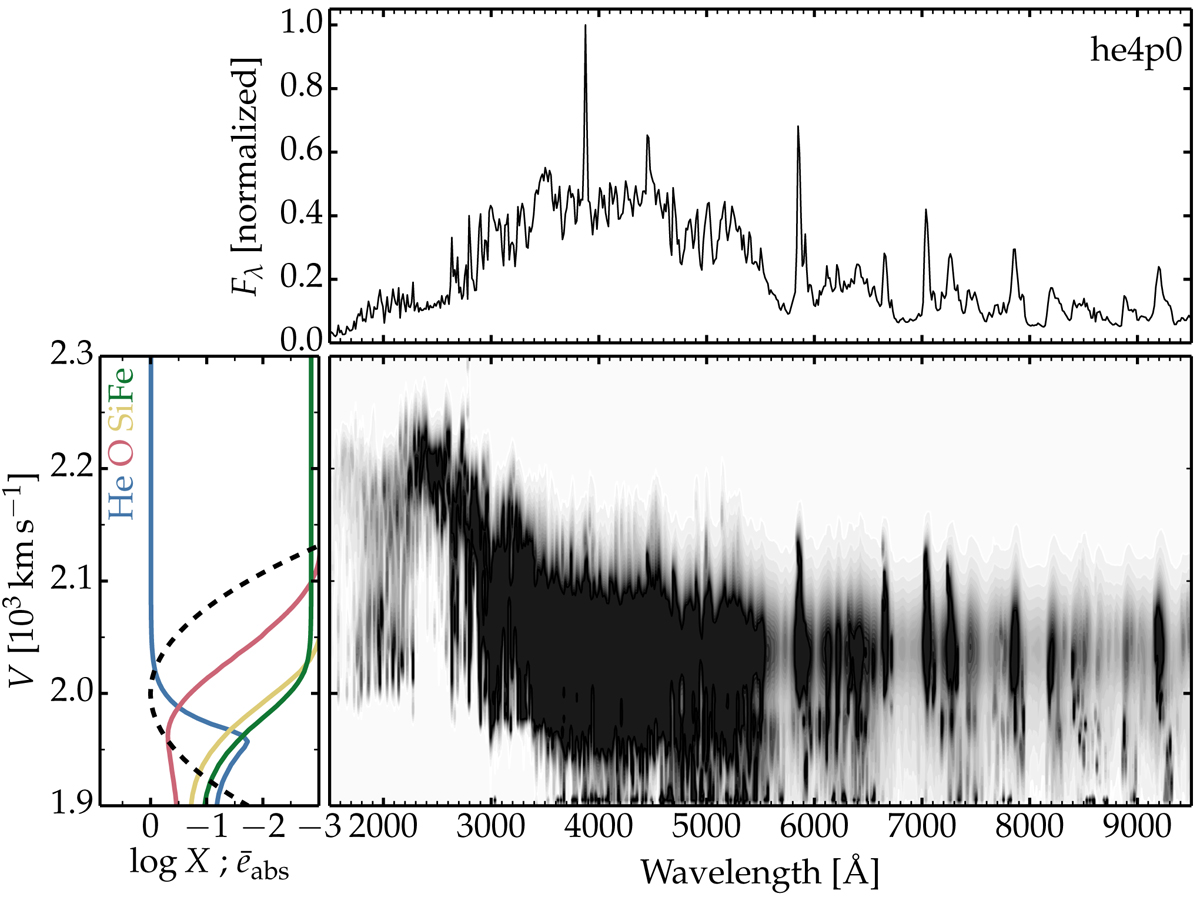
Fig. 7.
Download original image
Illustration of the spectrum formation region for the model shown in Fig. 5. The top panel shows the normalized flux between 1500 and 9500 Å. The left panel shows the mass fraction (colored solid line) and the normalized power deposition profile (dashed) versus velocity. The central panel is a grayscale image of the observer’s frame flux contribution ∂Fλ, V/∂V (the map maximum is saturated at 20% of the true maximum to bias against the strong emission lines and better reveal the origin of the weaker emission). This map shows that a significant fraction of the Fe II emission arises from regions where iron has a solar metallicity abundance.
Current usage metrics show cumulative count of Article Views (full-text article views including HTML views, PDF and ePub downloads, according to the available data) and Abstracts Views on Vision4Press platform.
Data correspond to usage on the plateform after 2015. The current usage metrics is available 48-96 hours after online publication and is updated daily on week days.
Initial download of the metrics may take a while.