Fig. 6.
Download original image
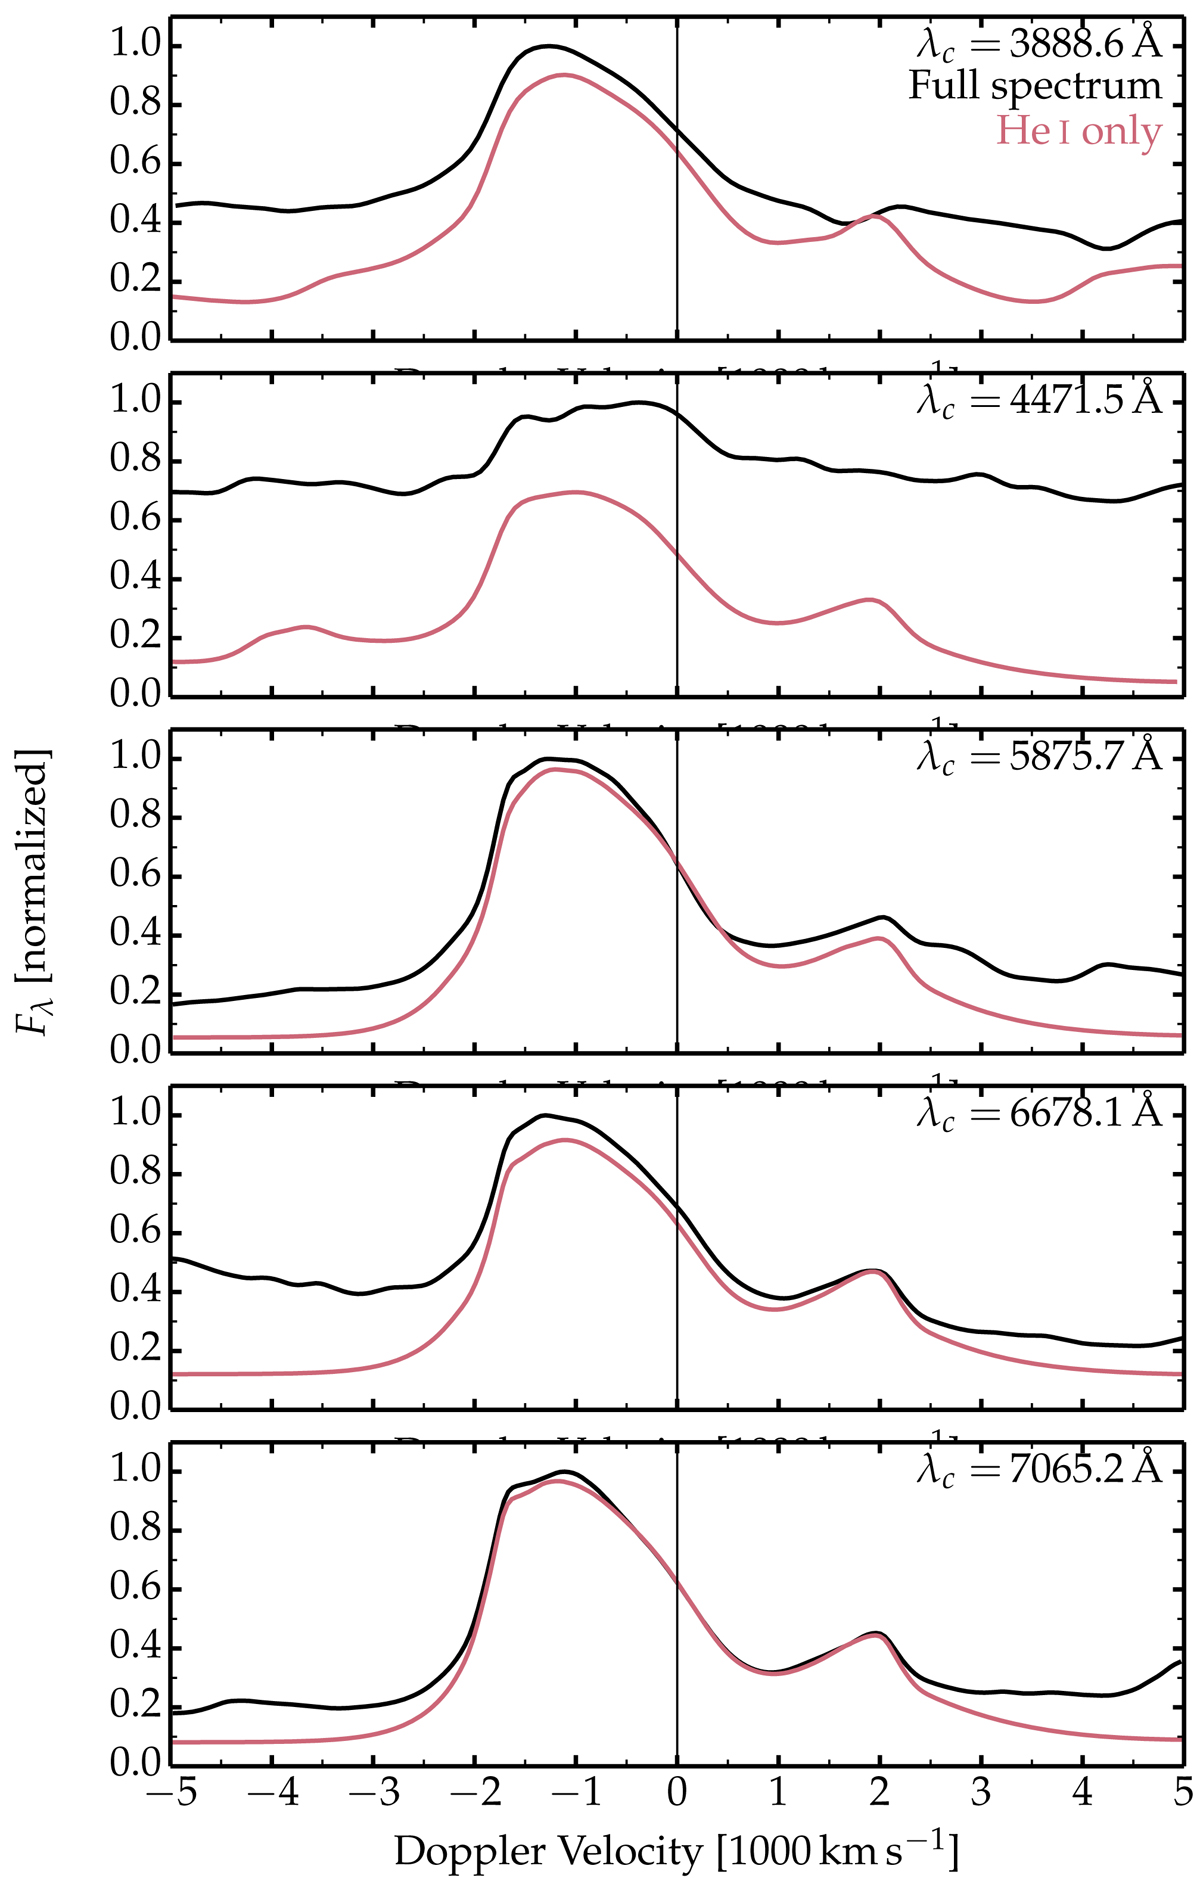
Illustration of the total flux (black) and that due to He I bound-bound transitions (red) in the spectral regions centered on 3888.6, 4471.5, 5875.7, 6678.1, and 7065.2 Å. In each panel, a normalization is applied so that the total flux peaks at one – the same normalization is then used for the He I spectrum. A vertical offset between the two curves is typically caused by Fe II emission. To erase a small level of high-frequency noise in the models, all spectra have been convolved with a Gaussian kernel (with a FWHM of 4.7 Å– standard deviation of 2.0 Å).
Current usage metrics show cumulative count of Article Views (full-text article views including HTML views, PDF and ePub downloads, according to the available data) and Abstracts Views on Vision4Press platform.
Data correspond to usage on the plateform after 2015. The current usage metrics is available 48-96 hours after online publication and is updated daily on week days.
Initial download of the metrics may take a while.