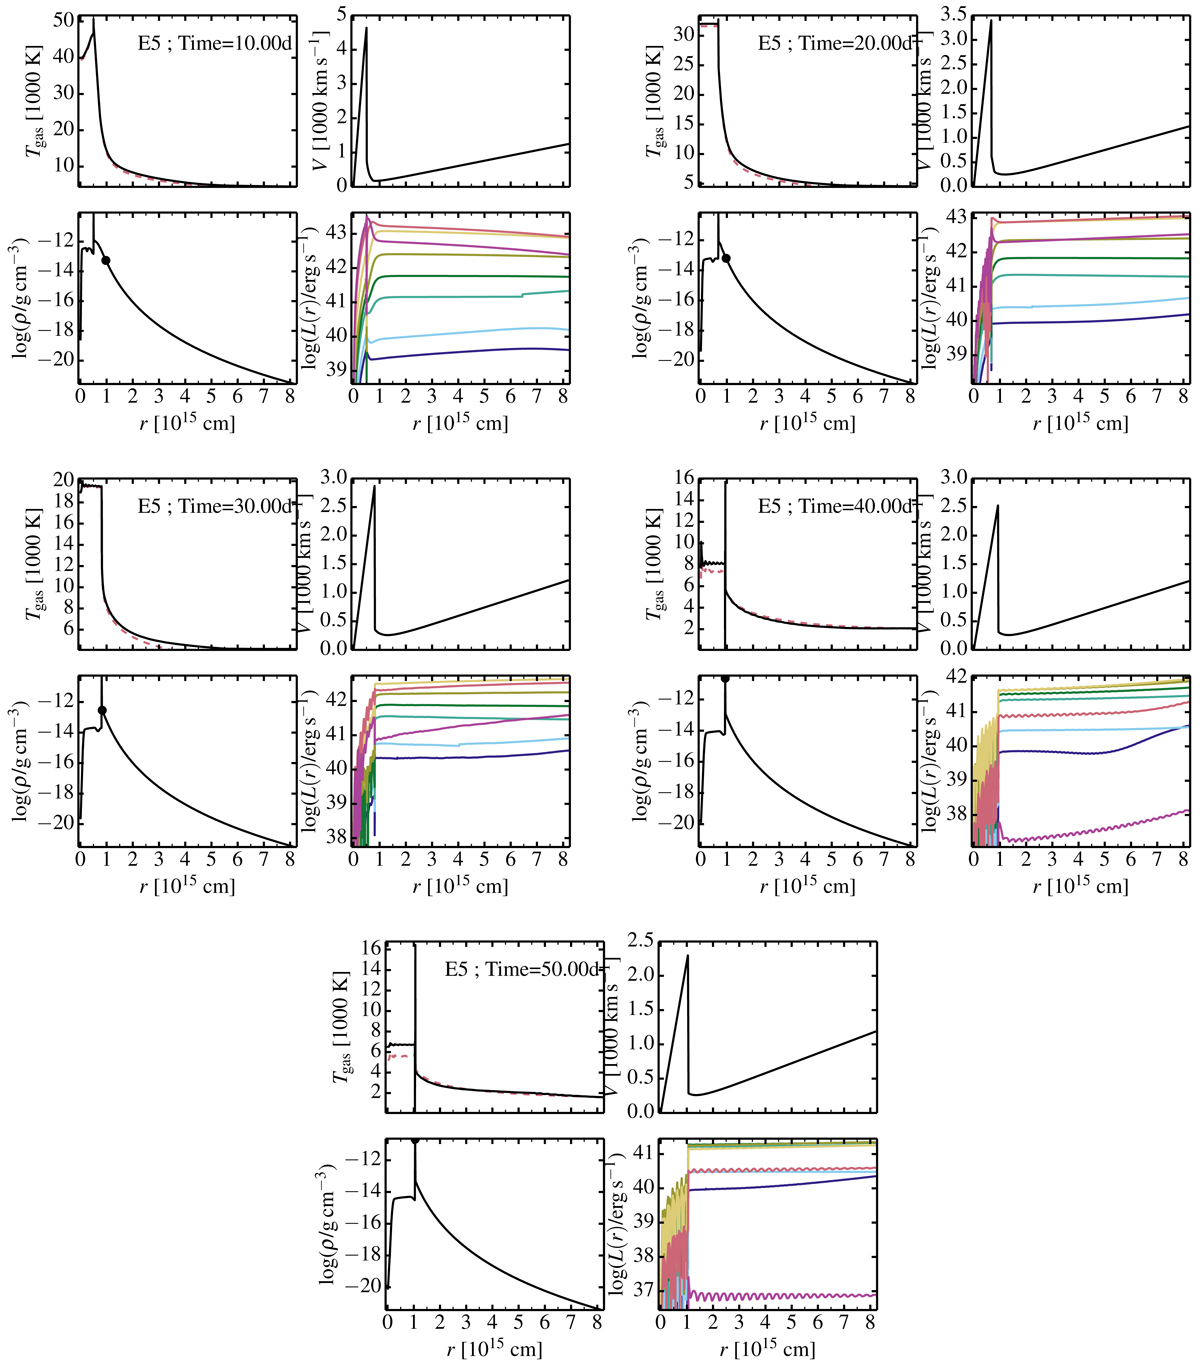
Fig. A.2.
Download original image
Radial profile of the gas temperature Tgas, the velocity V, the mass density ρ, the luminosity L(r) for model E5 at 10, 20, 30, 40, and 50 d after the onset of interaction. The black dot in the bottom left panel indicates the location of the electron-scattering photosphere (where the inward integrated electron-scattering optical depth is 2/3).
Current usage metrics show cumulative count of Article Views (full-text article views including HTML views, PDF and ePub downloads, according to the available data) and Abstracts Views on Vision4Press platform.
Data correspond to usage on the plateform after 2015. The current usage metrics is available 48-96 hours after online publication and is updated daily on week days.
Initial download of the metrics may take a while.