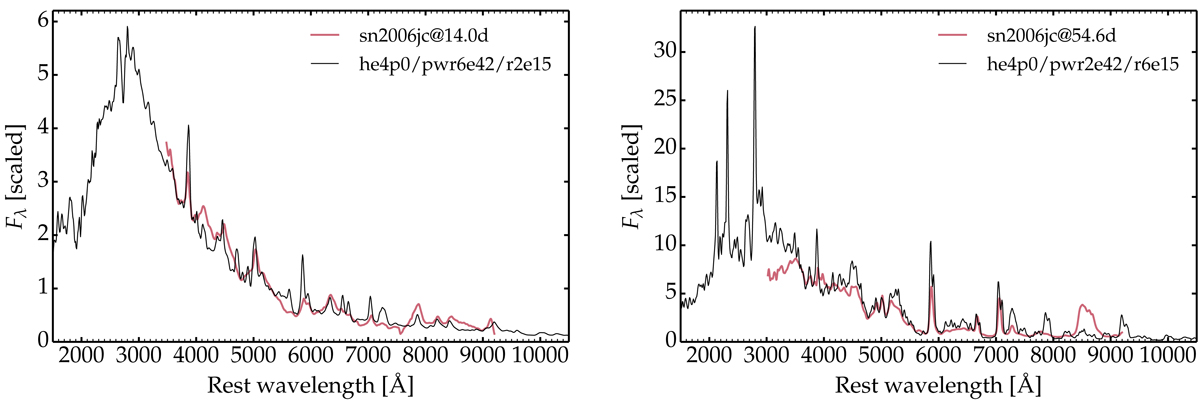
Fig. 12.
Download original image
Left: comparison between the observation of SN 2006jc on the 14th of October 2006, 14 d after the estimated time of maximum at MJD= 54 008, with the spectrum from a CDS whose mass and composition are based on model he4p0, placed at a radius of 2 × 1015 cm, moving at a velocity of 2000 km s−1 and powered at a rate of 6 × 1042 erg s−1. Right: same as left but now for the observations of SN 2006jc on 23rd of November 2006, 54.6 d after the estimated time of maximum, and for the same he4p0 model in a CDS at 6 × 1015 cm, moving at a velocity of 2000 km s−1 and powered at a rate of 2 × 1042 erg s−1. In both panels, the observations have been corrected for reddening (E(B − V) = 0.04 mag) and redshift (z= 0.005574). The model is normalized to the observations at 5300 Å (left panel) and at 5800 Å (right panel). Models and observations are smoothed with a Gaussian kernel (FWHM of 23.5 Å).
Current usage metrics show cumulative count of Article Views (full-text article views including HTML views, PDF and ePub downloads, according to the available data) and Abstracts Views on Vision4Press platform.
Data correspond to usage on the plateform after 2015. The current usage metrics is available 48-96 hours after online publication and is updated daily on week days.
Initial download of the metrics may take a while.