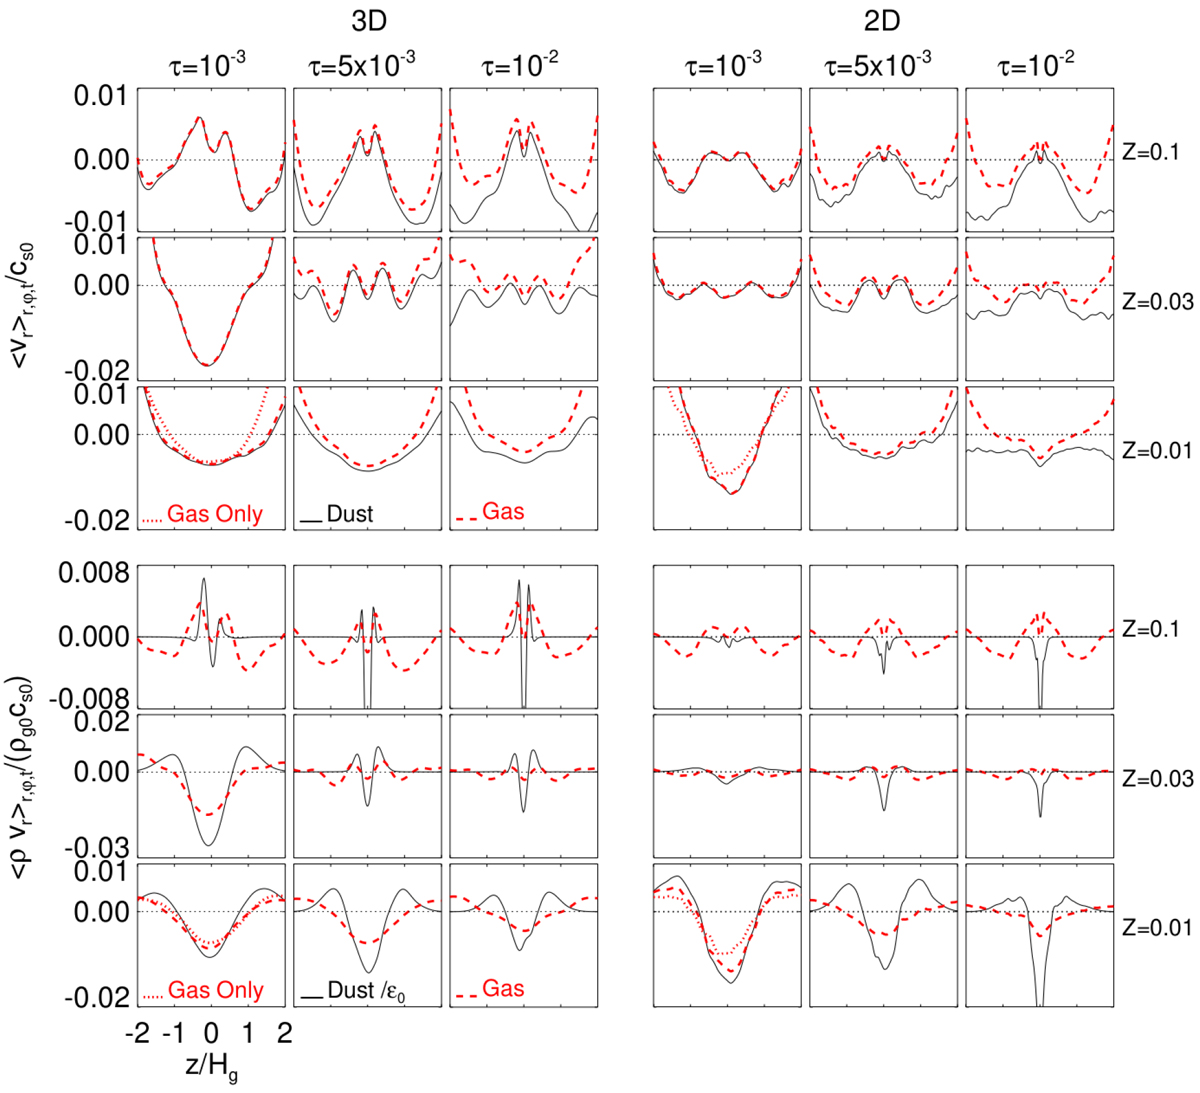
Fig. 8
Download original image
Vertical profiles of the averaged radial dust and gas velocities (upper three rows) and the dust and gas mass flows (lower three rows) in 3D (left panels) and 2D (right panels) simulations. The Stokes number τ0 increases from left to right while Z increases from the lower to upper panels. For comparison, in the panels corresponding to Z = 0.01 and τ0 = 10−3 we additionally plot the result of a dust-free simulation. Averages have been taken over the last 400 orbits and over 0.8 ≤ R ≤ 1.2. The dust mass flows are additionally scaled with a factor 1∕ϵ0 as compared to the gas mass flows. The horizontal axis displays − 2Hg ≤ z ≤ 2Hg in all panels.
Current usage metrics show cumulative count of Article Views (full-text article views including HTML views, PDF and ePub downloads, according to the available data) and Abstracts Views on Vision4Press platform.
Data correspond to usage on the plateform after 2015. The current usage metrics is available 48-96 hours after online publication and is updated daily on week days.
Initial download of the metrics may take a while.