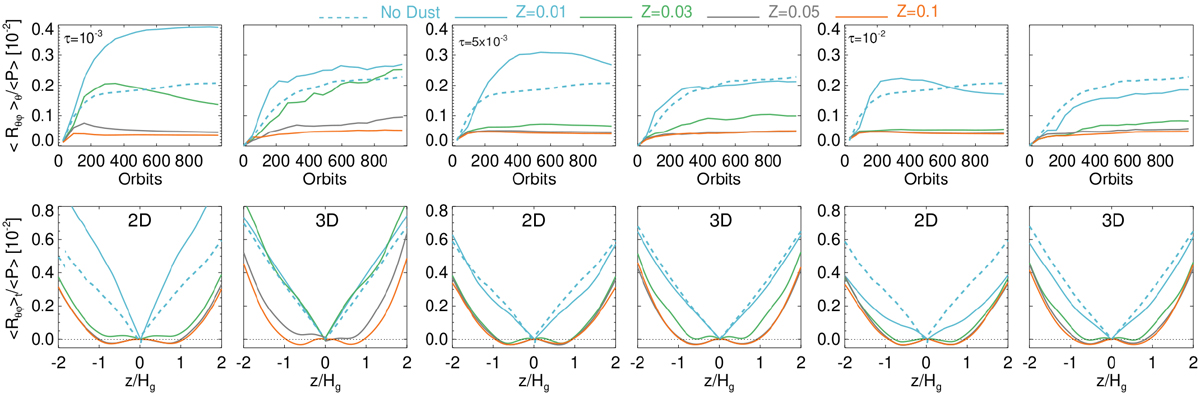
Fig. 6
Download original image
Comparison of the vertical Reynolds stress (43) in 2D and 3D simulations for different metallicities, Z, and Stokes numbers, τ0. Upper panels: running time-averages (spatially averaged over the entire diagnostic domain 0.8 ≤ R ≤ 1.2), while the lower panels display the time-averaged (over the last 400 orbits) vertical profiles. The dashed curve is in all panels for 2D and 3D the same, respectively. The horizontal dotted line indicates “zero”, such that positive and negative values correspond to angular momentum transport away from the mid-plane and towards the mid-pane, respectively.
Current usage metrics show cumulative count of Article Views (full-text article views including HTML views, PDF and ePub downloads, according to the available data) and Abstracts Views on Vision4Press platform.
Data correspond to usage on the plateform after 2015. The current usage metrics is available 48-96 hours after online publication and is updated daily on week days.
Initial download of the metrics may take a while.