Fig. 4
Download original image
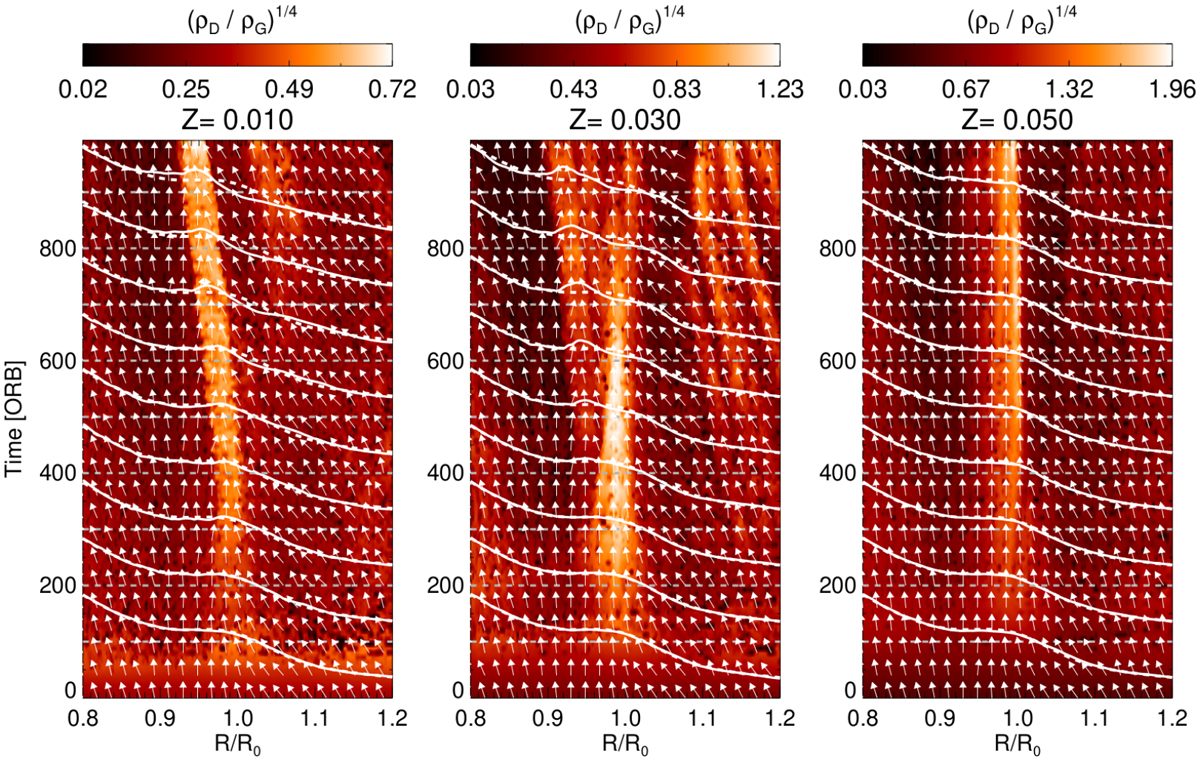
Time evolution of the dust-to-gas ratio in the vicinity of a pressure bump with amplitude A = 0.4. Compared from left to right are different metallicities Z = 0.01, 0.03, 0.05 with the same τ0 = 4 × 10⁻³. The over-plotted solid curves are the mid-plane gas pressure at times indicated by horizontal dashed lines. The dashed curves are the initial gas pressure for comparison. The arrows indicate the direction of dust movement as predicted by Eq. (36) and are all normalized to have the same length.
Current usage metrics show cumulative count of Article Views (full-text article views including HTML views, PDF and ePub downloads, according to the available data) and Abstracts Views on Vision4Press platform.
Data correspond to usage on the plateform after 2015. The current usage metrics is available 48-96 hours after online publication and is updated daily on week days.
Initial download of the metrics may take a while.