Free Access
Fig. 9
Download original image
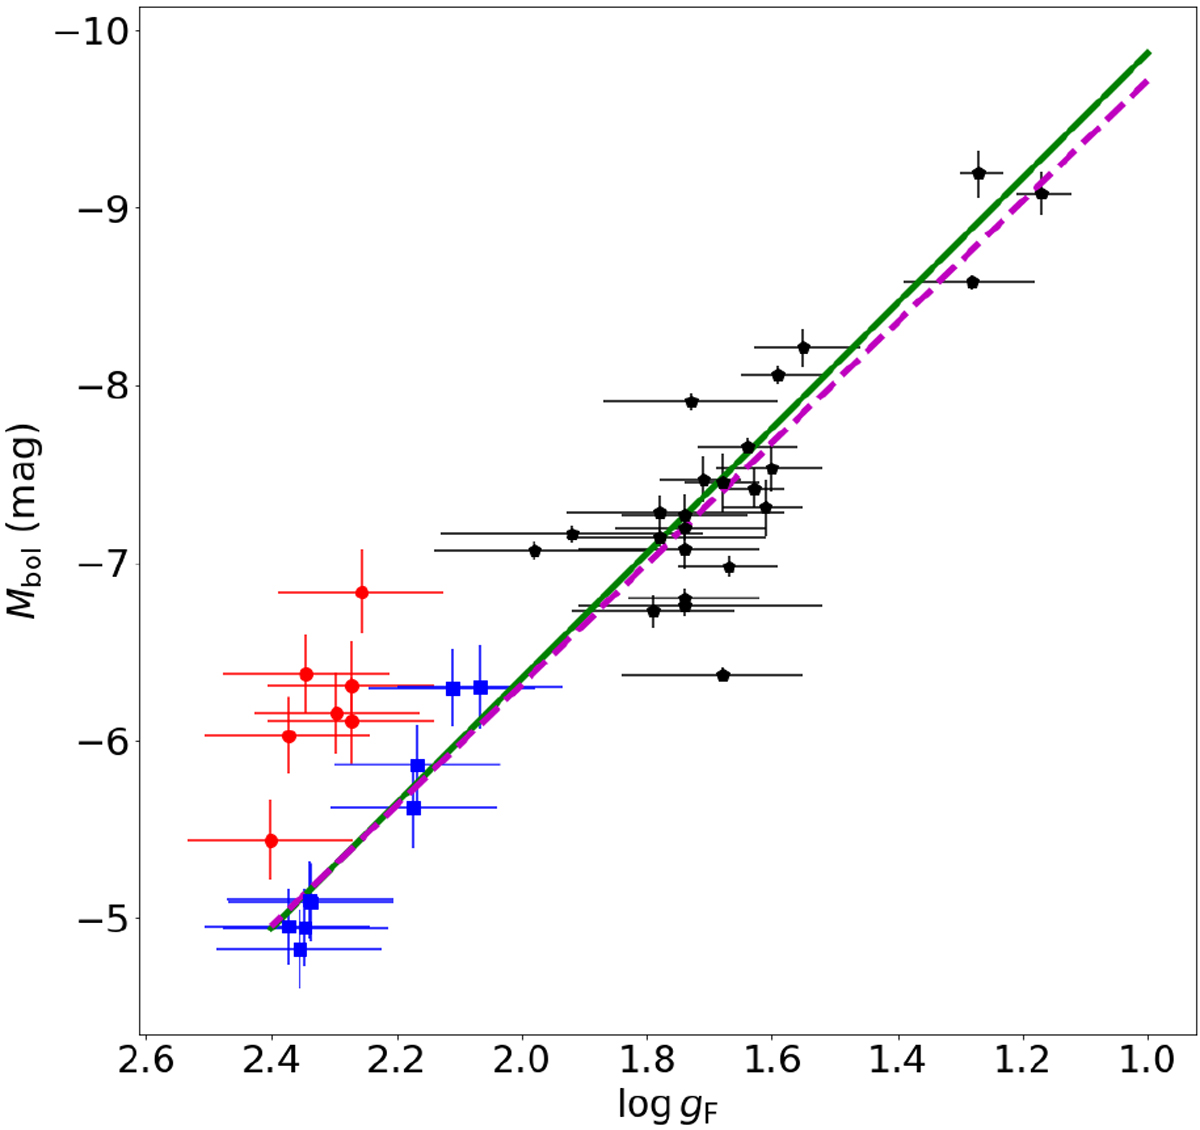
FGLR for the stars in NGC 300. Black symbols denote the stars studied by Kudritzki et al. (2008), with the corresponding FGLR regression line marked in solid green. Blue and red symbols mark the stars analysed here, with the magenta-dashed line representing the regression line derived from the black and blue symbols.
Current usage metrics show cumulative count of Article Views (full-text article views including HTML views, PDF and ePub downloads, according to the available data) and Abstracts Views on Vision4Press platform.
Data correspond to usage on the plateform after 2015. The current usage metrics is available 48-96 hours after online publication and is updated daily on week days.
Initial download of the metrics may take a while.