Free Access
Fig. 7
Download original image
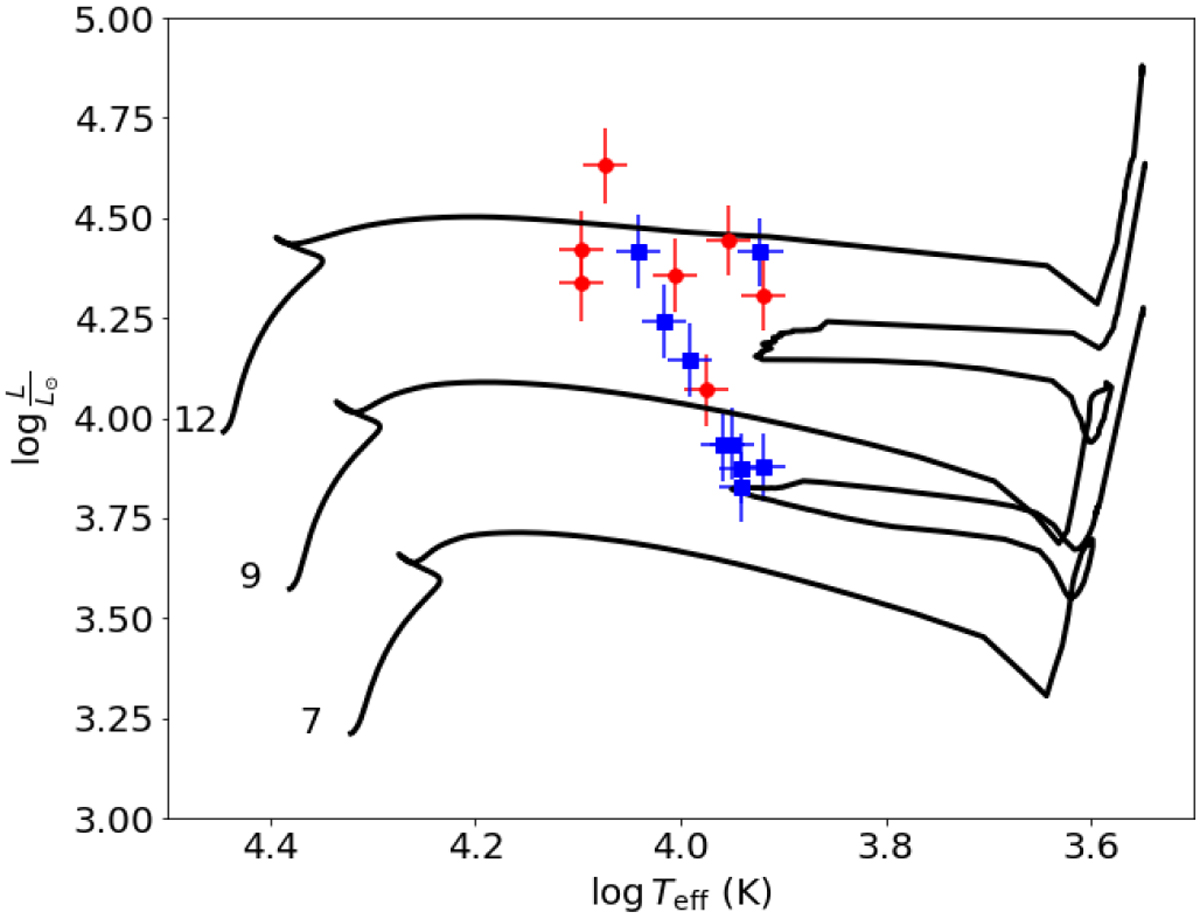
HRD with evolutionary tracks for different masses (black solid lines, in M⊙) that account for rotation (Ekström et al. 2012). The red dots represent sample stars that move by more than 10% their evolutionary mass track position with respect to the sHRD in Fig. 8, and the blue squares are those that move less than 10%.
Current usage metrics show cumulative count of Article Views (full-text article views including HTML views, PDF and ePub downloads, according to the available data) and Abstracts Views on Vision4Press platform.
Data correspond to usage on the plateform after 2015. The current usage metrics is available 48-96 hours after online publication and is updated daily on week days.
Initial download of the metrics may take a while.