Free Access
Fig. 2
Download original image
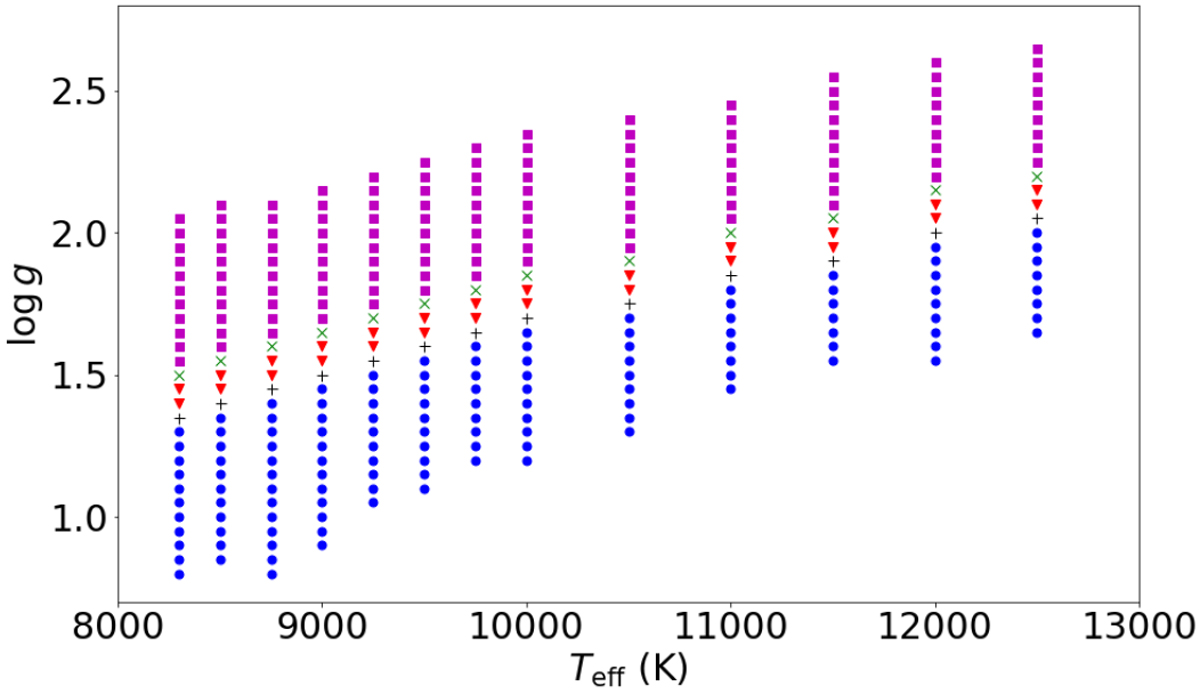
Parameter coverage of the model atmosphere grid used in the present work. The different symbols refer to the microturbulent velocities ξ adopted in the computation of the models. Blue circles indicate ξ = 8 km s−1, black pluses 7 km s−1, red triangles 6 km s−1, green crosses5 km s−1, and magentadiamonds 4 km s−1.
Current usage metrics show cumulative count of Article Views (full-text article views including HTML views, PDF and ePub downloads, according to the available data) and Abstracts Views on Vision4Press platform.
Data correspond to usage on the plateform after 2015. The current usage metrics is available 48-96 hours after online publication and is updated daily on week days.
Initial download of the metrics may take a while.