Free Access
Fig. 1
Download original image
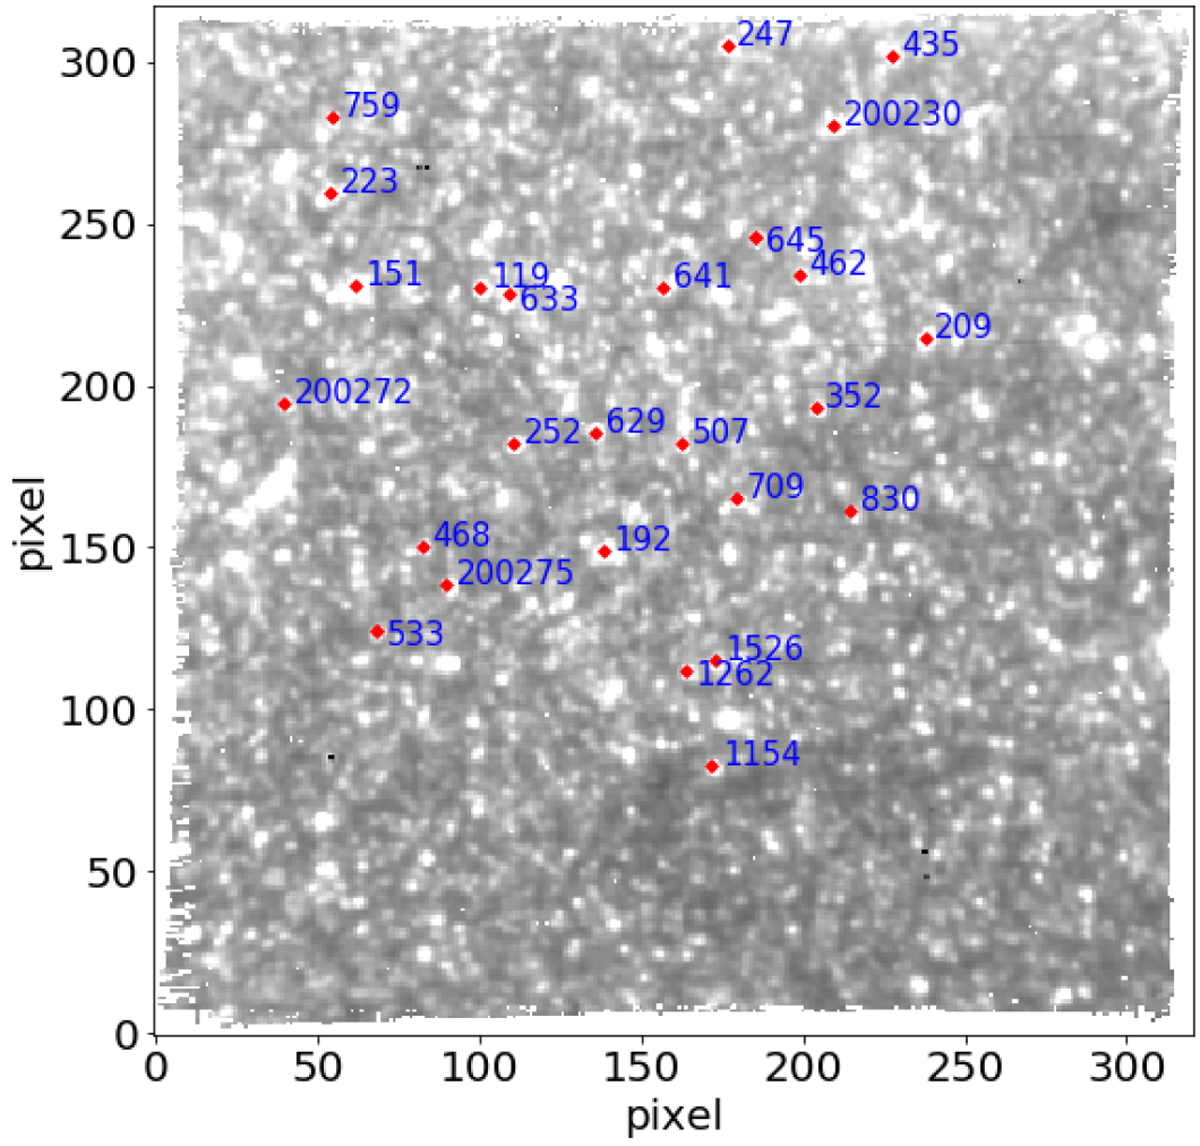
Chart of NGC 300 field (i) with the programme stars marked in red and their ID numbers in blue (according to Paper I). The image is stacked over all recorded wavelengths in the datacube.
Current usage metrics show cumulative count of Article Views (full-text article views including HTML views, PDF and ePub downloads, according to the available data) and Abstracts Views on Vision4Press platform.
Data correspond to usage on the plateform after 2015. The current usage metrics is available 48-96 hours after online publication and is updated daily on week days.
Initial download of the metrics may take a while.