Fig. 9
Download original image
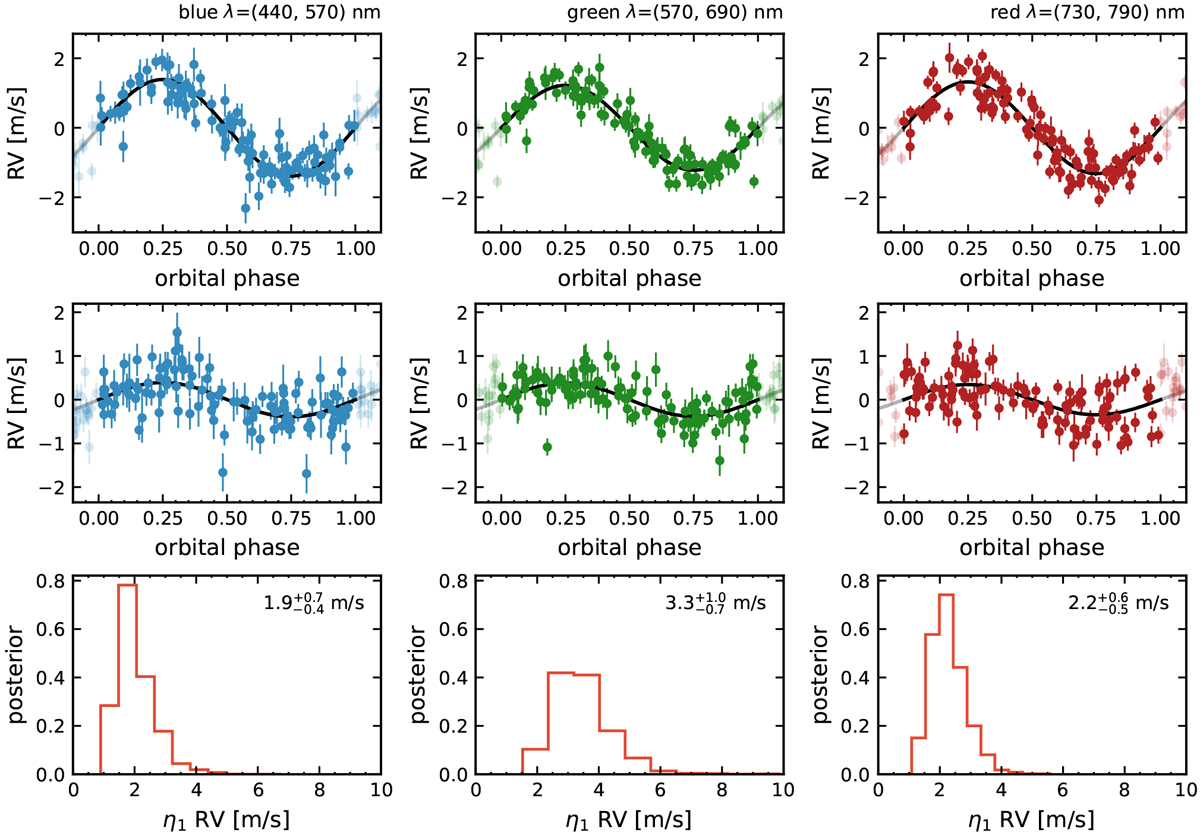
Analysis of chromatic TM RVs. Three columns: results for the blue, green, and red regions, corresponding to the wavelengths between 440–570 nm, 570–690 nm, and 730–790 nm, respectively. Top and middle panels: ESPRESSO RVs phase-folded at the 11 and 5-day periods, together with the maximum likelihood solution for each signal. Bottom panels: posteriors for the GP amplitude, η1 RV, with the posterior median and 68% quantiles as labels.
Current usage metrics show cumulative count of Article Views (full-text article views including HTML views, PDF and ePub downloads, according to the available data) and Abstracts Views on Vision4Press platform.
Data correspond to usage on the plateform after 2015. The current usage metrics is available 48-96 hours after online publication and is updated daily on week days.
Initial download of the metrics may take a while.