Fig. 8
Download original image
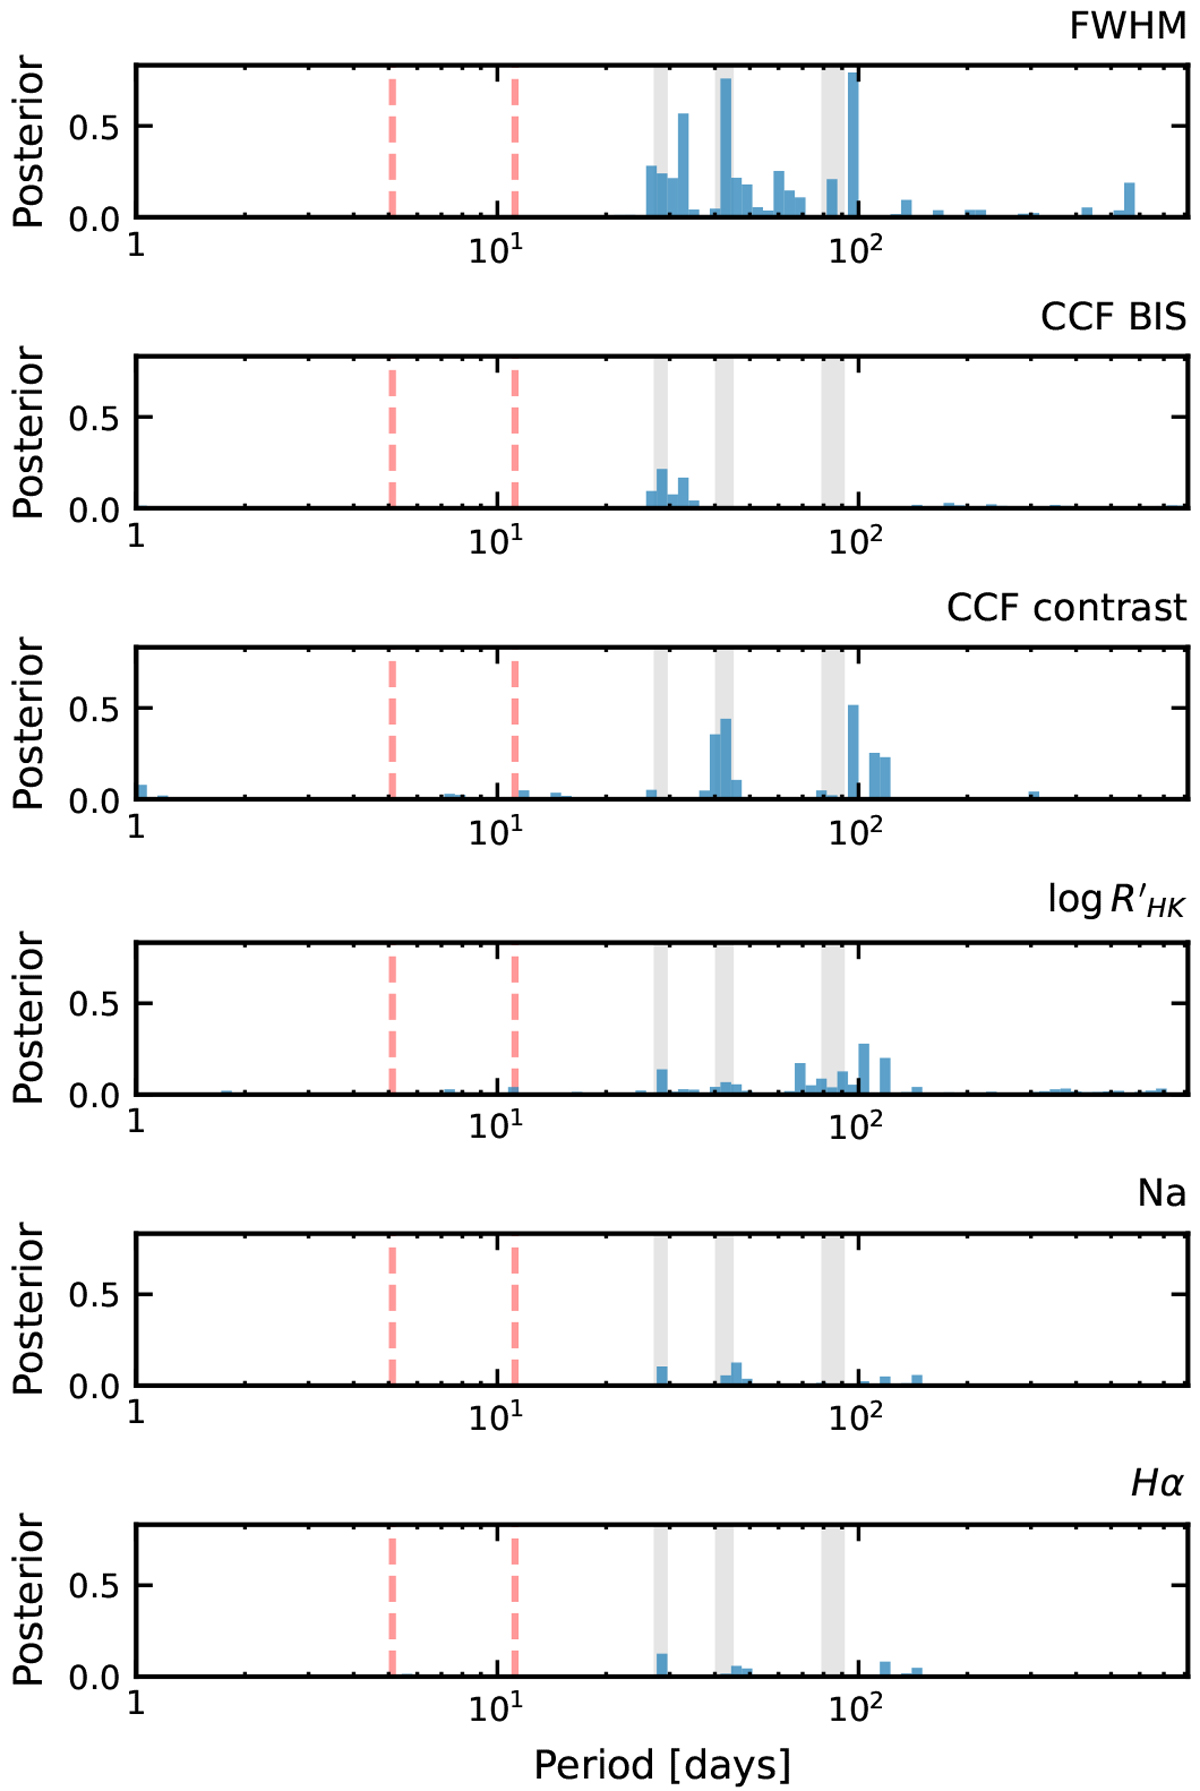
Posterior distributions for the periods of sinusoids in the analysis of activity indicators. The distributions are normalised and shown on the same vertical scale, which allows for a visual comparison of the significance of the periodicities. For example, the CCF contrast shows more significant periodicities (close to 100 and 40 days) than the Hα index. The stellar rotation period and its first and second harmonics are denoted with filled lines, and the 11-day and 5-day signals detected in the RVs with dashed red lines.
Current usage metrics show cumulative count of Article Views (full-text article views including HTML views, PDF and ePub downloads, according to the available data) and Abstracts Views on Vision4Press platform.
Data correspond to usage on the plateform after 2015. The current usage metrics is available 48-96 hours after online publication and is updated daily on week days.
Initial download of the metrics may take a while.