Fig. 3
Download original image
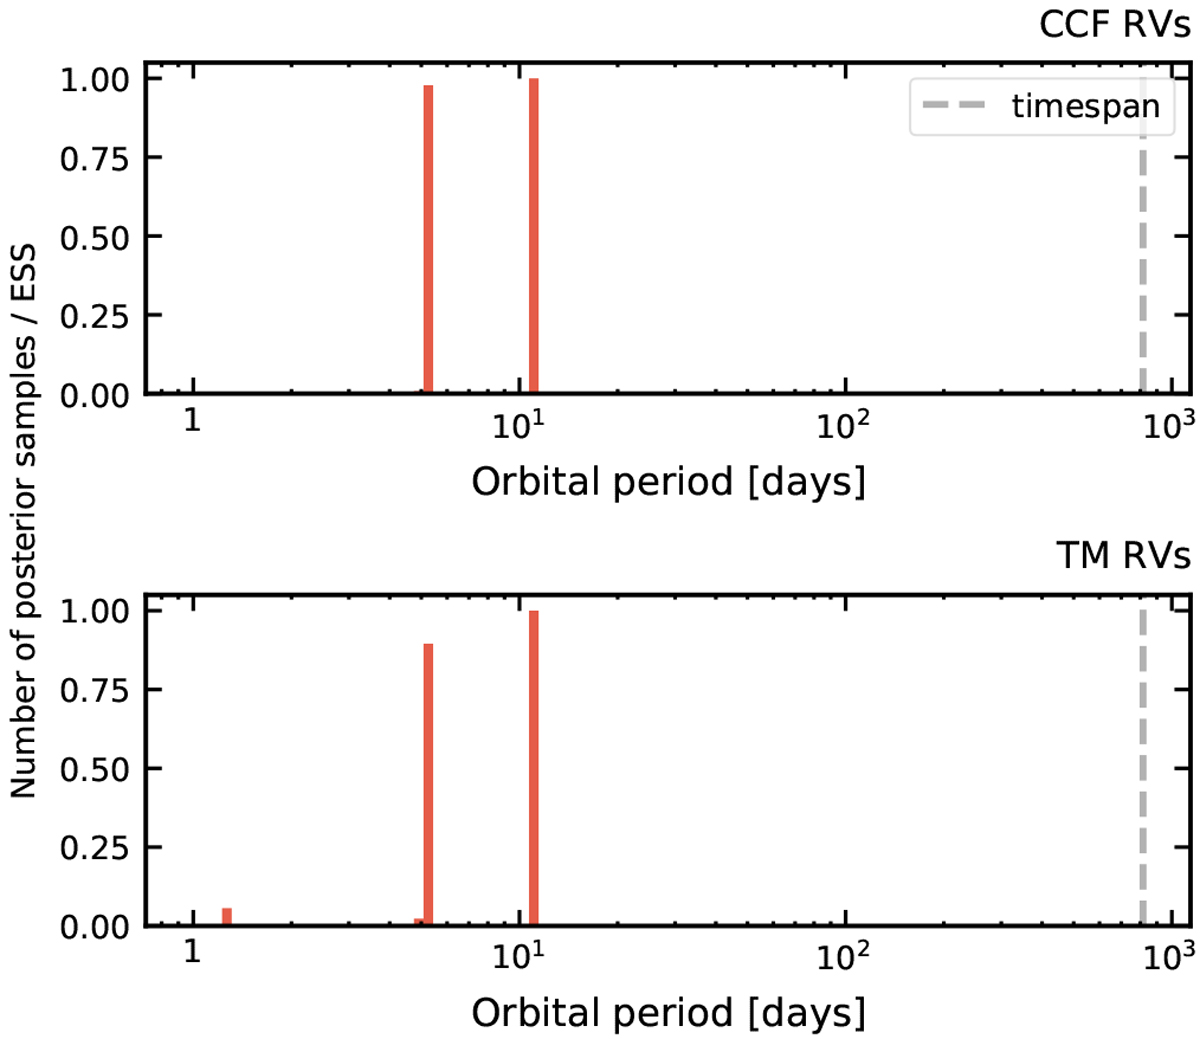
Posterior distribution for the orbital periods in the two-planet model from the analysis of the CCF RVs (top) and TM RVs (bottom). The posteriors are shown normalised by the ESS per histogram bin (so the maximum possible value in the abscissa is 1). The prior is log-uniform from 1 day to the time span of the data, which is marked with a dashed line.
Current usage metrics show cumulative count of Article Views (full-text article views including HTML views, PDF and ePub downloads, according to the available data) and Abstracts Views on Vision4Press platform.
Data correspond to usage on the plateform after 2015. The current usage metrics is available 48-96 hours after online publication and is updated daily on week days.
Initial download of the metrics may take a while.