Fig. 2
Download original image
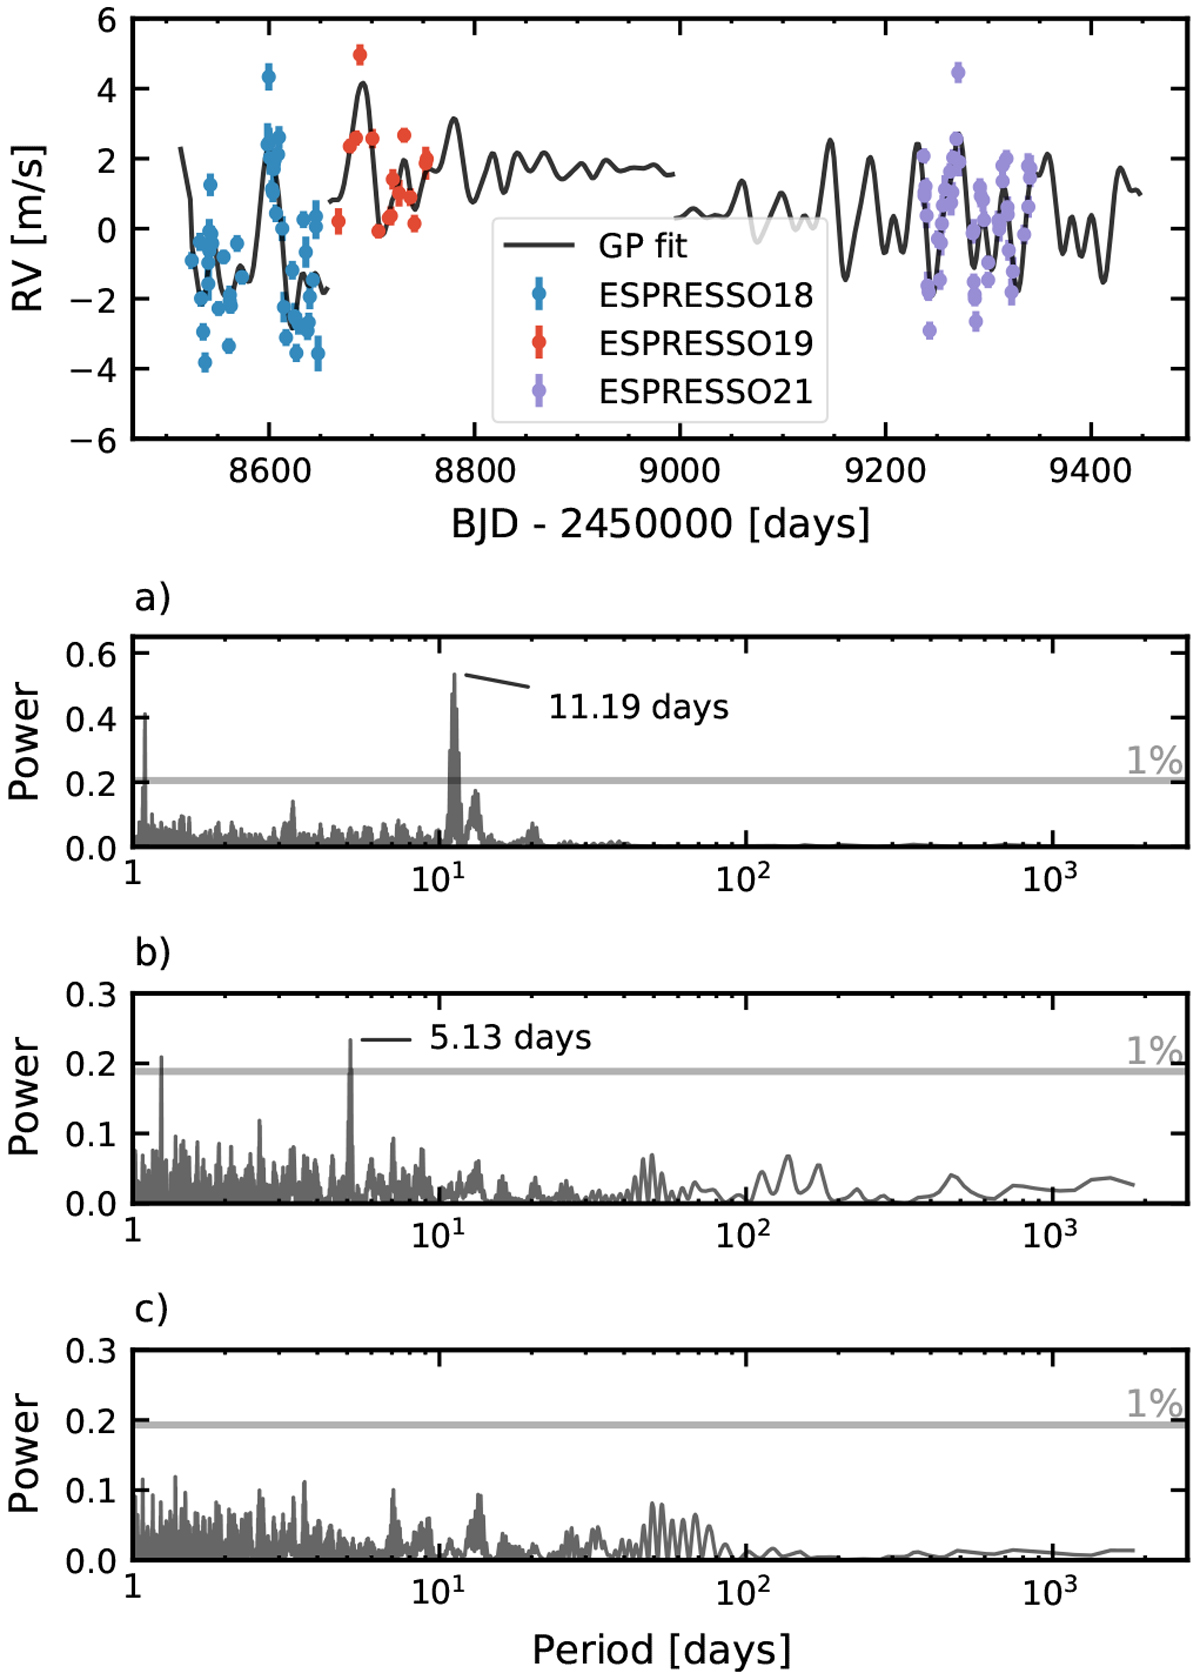
Pre-whitening procedure applied to the CCF RVs. Top panel: observed RVs together with the GP prediction. The periodogram of the residuals from this fit is shown in panel a, and the periodograms after two successive sinusoidal fits are in panels b and c. The false alarm probability of 1%, calculated with bootstrap randomisation, is shown by the horizontal grey lines.
Current usage metrics show cumulative count of Article Views (full-text article views including HTML views, PDF and ePub downloads, according to the available data) and Abstracts Views on Vision4Press platform.
Data correspond to usage on the plateform after 2015. The current usage metrics is available 48-96 hours after online publication and is updated daily on week days.
Initial download of the metrics may take a while.