Fig. 3.
Download original image
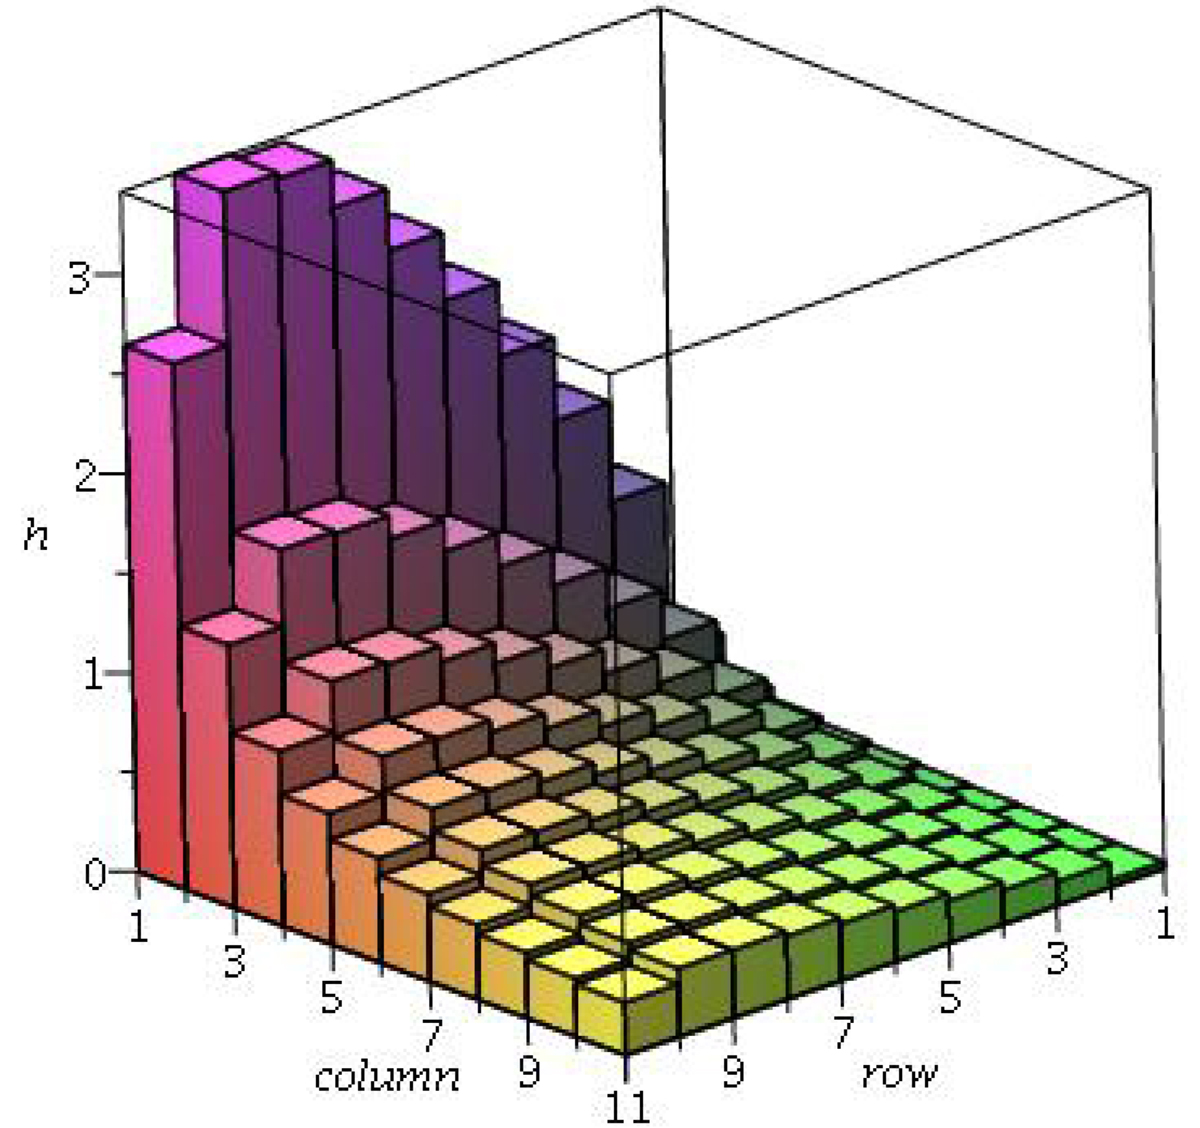
Diagram showing the value on each patch of the RM in the second quadrant of our example. Other quadrants are the same except for sign. The color is merely shading and has no physical significance. To ensure that we are looking along the negative y-axis across the positive x-axis, the row is 11 − x, and the column is the z-axis. The observer is looking down from the left.
Current usage metrics show cumulative count of Article Views (full-text article views including HTML views, PDF and ePub downloads, according to the available data) and Abstracts Views on Vision4Press platform.
Data correspond to usage on the plateform after 2015. The current usage metrics is available 48-96 hours after online publication and is updated daily on week days.
Initial download of the metrics may take a while.