Free Access
Fig. 3.
Download original image
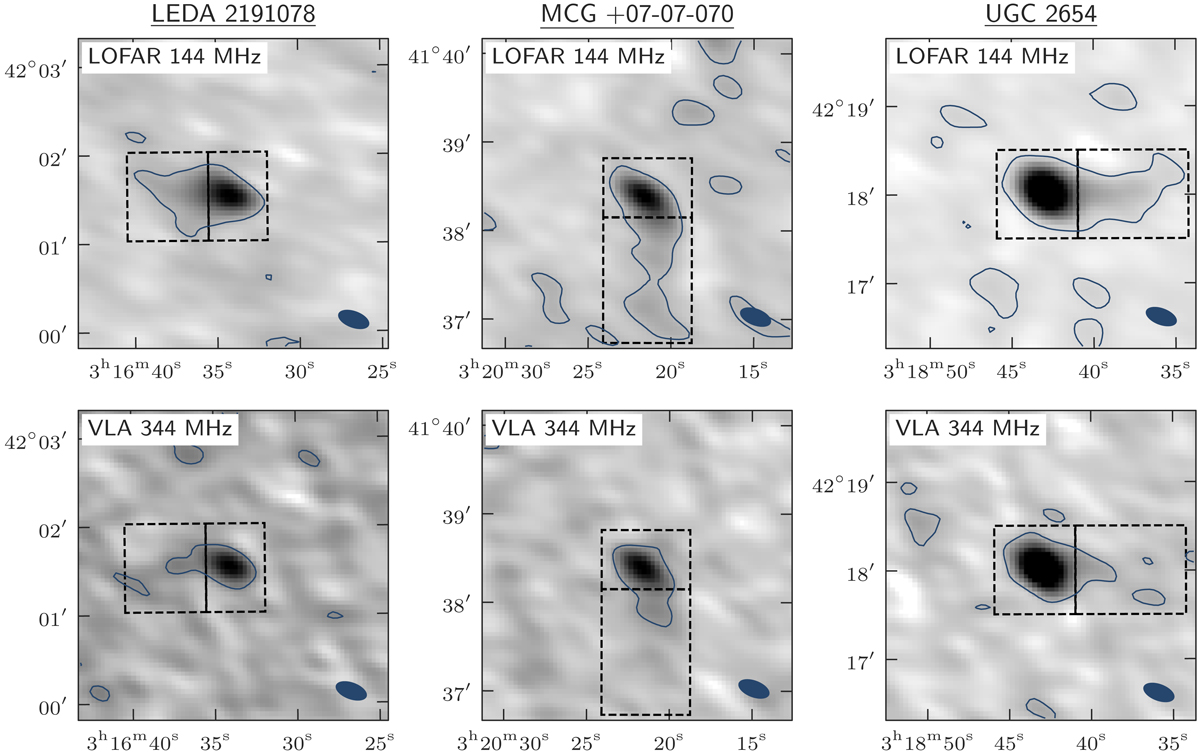
Low resolution LOFAR 144 MHz cutouts (top row) and VLA 344 MHz cutouts (bottom row) of LEDA 2191078, MCG +07-07-070, and UGC 2654. The dashed boxes show the regions used to measure the “galaxy” and “tail” spectral indices. The 22″ × 11″ (7.5 kpc × 3.7 kpc) beam is shown in the lower right.
Current usage metrics show cumulative count of Article Views (full-text article views including HTML views, PDF and ePub downloads, according to the available data) and Abstracts Views on Vision4Press platform.
Data correspond to usage on the plateform after 2015. The current usage metrics is available 48-96 hours after online publication and is updated daily on week days.
Initial download of the metrics may take a while.