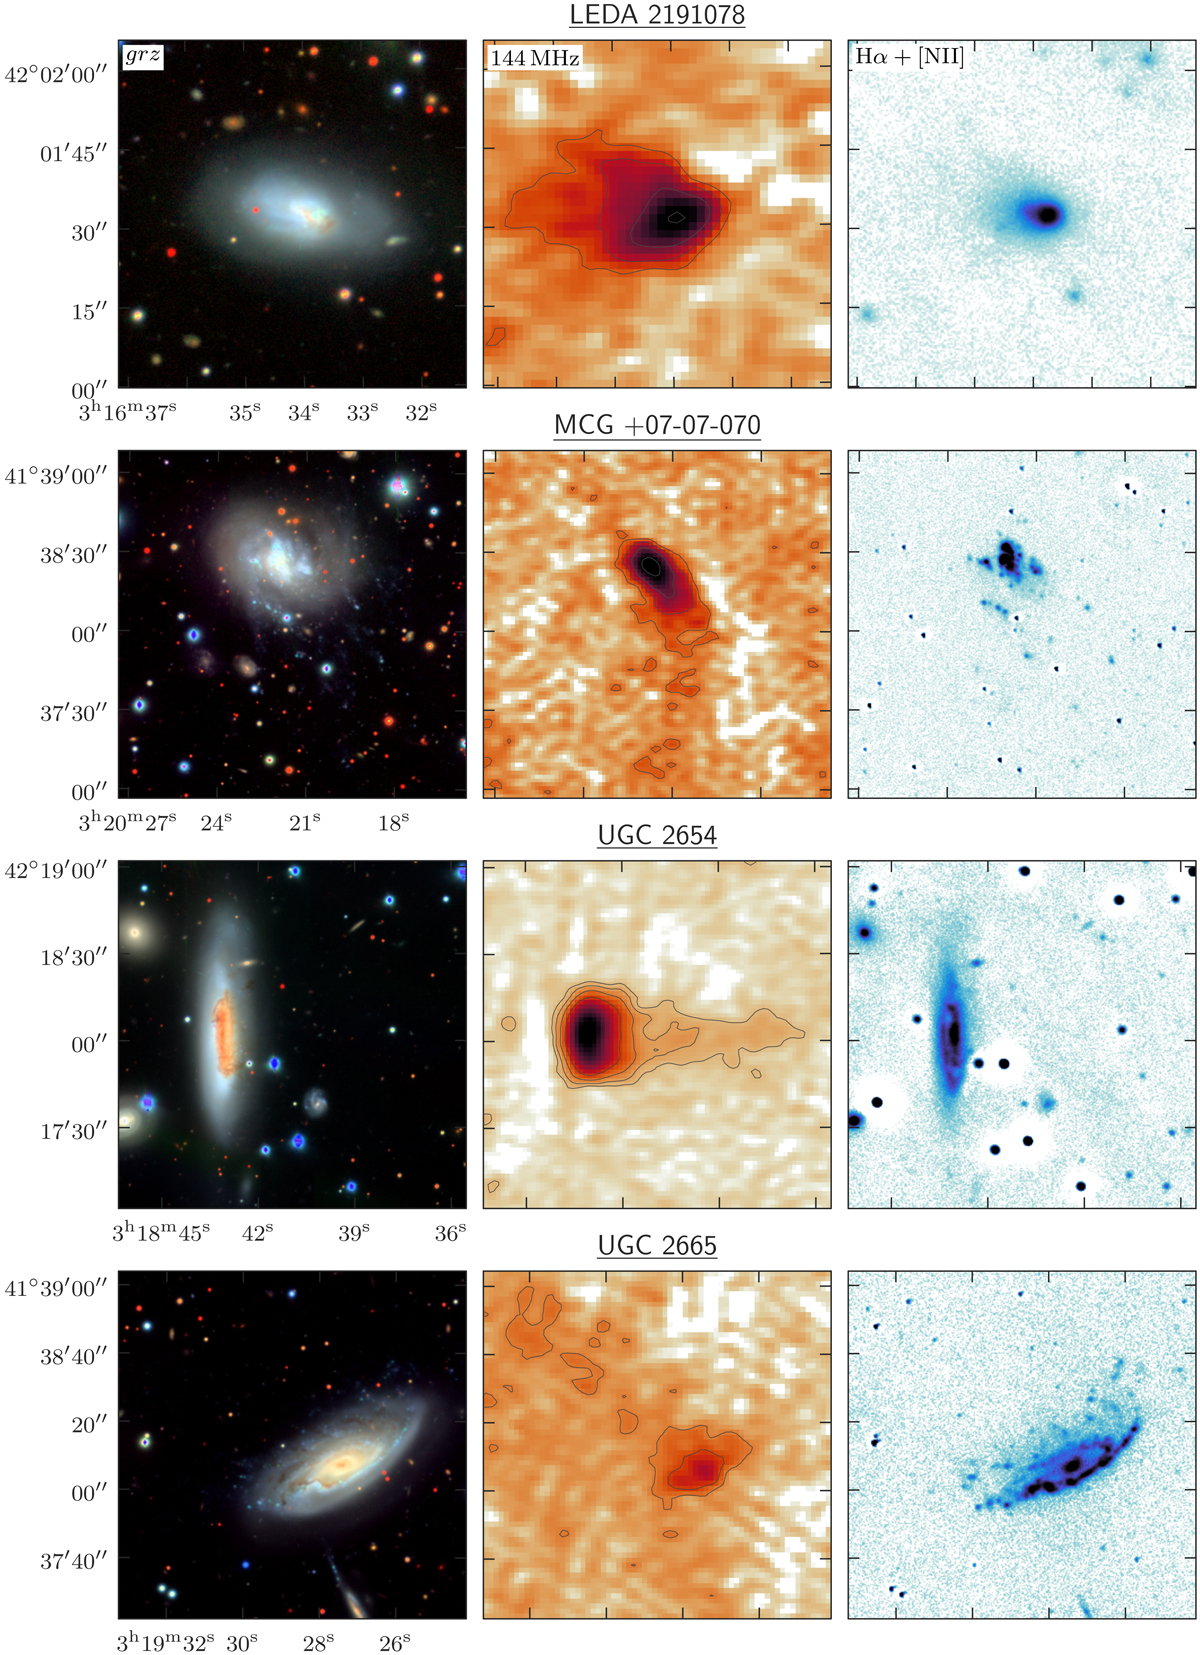
Fig. 2.
Download original image
Panel images, highlighting the identified jellyfish galaxies at multiple wavelengths. Left-hand column shows grz optical images from Subaru HSC. Middle column shows LOFAR 144 MHz images, with contours shown at the {3σ, 6σ, 12σ, …} level (σ = 100 μJy beam−1 for the LOFAR image) and the 6″ LOFAR beam shown in the lower left. Right-hand column shows the INT narrowband Hα + [NII] image if available, and otherwise the SDSS u-band image.
Current usage metrics show cumulative count of Article Views (full-text article views including HTML views, PDF and ePub downloads, according to the available data) and Abstracts Views on Vision4Press platform.
Data correspond to usage on the plateform after 2015. The current usage metrics is available 48-96 hours after online publication and is updated daily on week days.
Initial download of the metrics may take a while.