Open Access
Fig. 5.
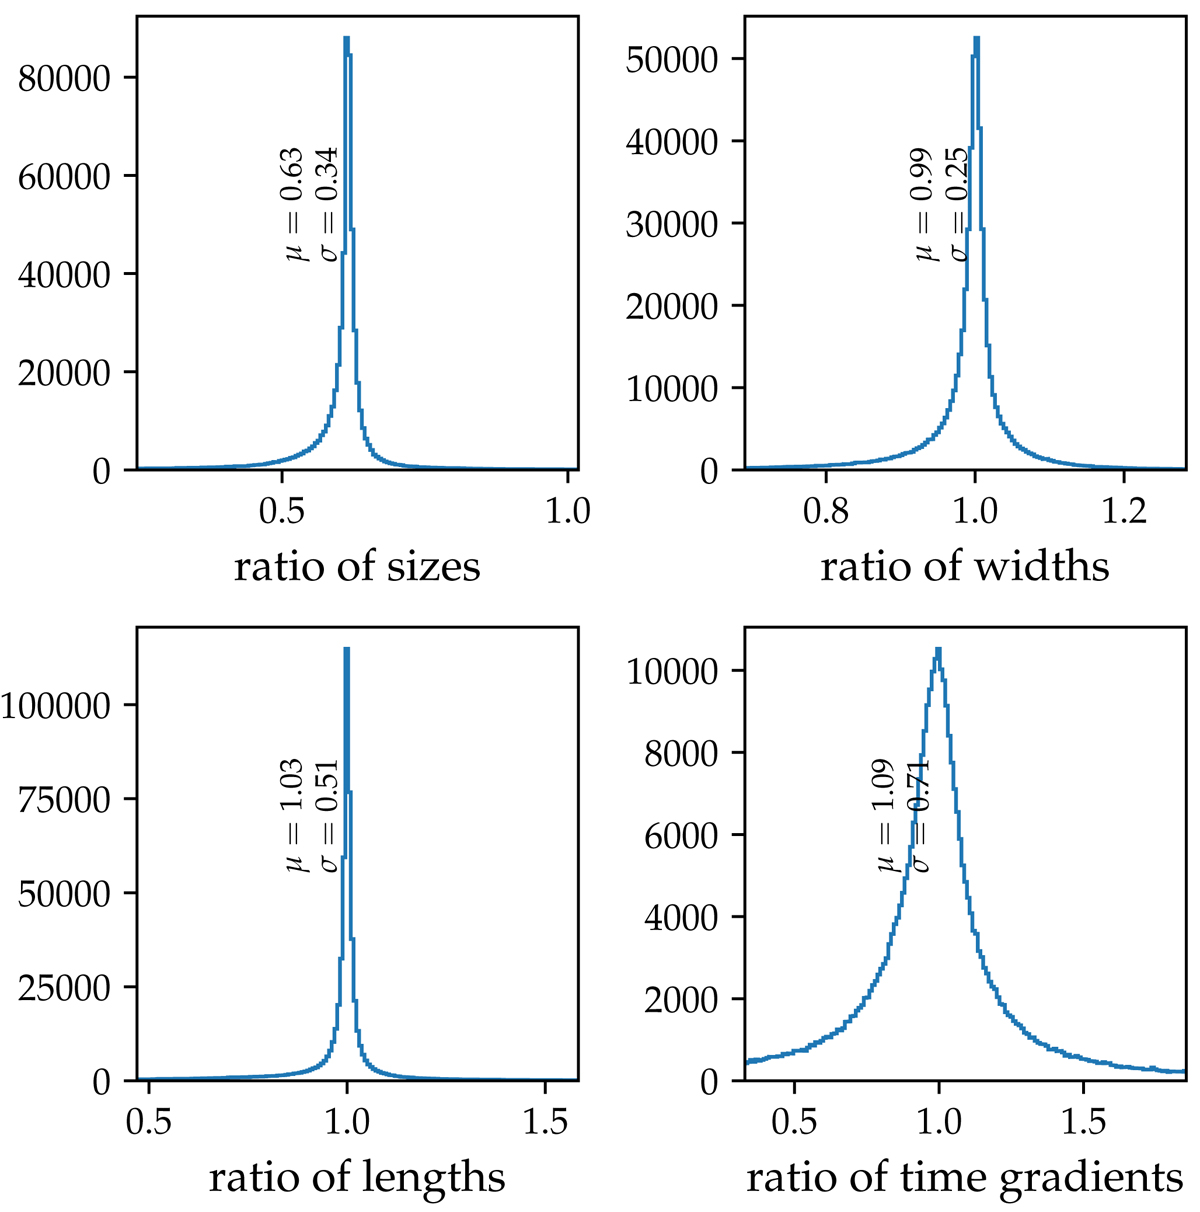
Download original image
Ratio between image parameters derived from MC simulations for the season 2019–2020 vs season 2012–2013a (Telescope T1 only, winter simulations, noise level of 100 MHz, and no size cuts). The vertical axis of each panel shows the number of events within a given ratio bin.
Current usage metrics show cumulative count of Article Views (full-text article views including HTML views, PDF and ePub downloads, according to the available data) and Abstracts Views on Vision4Press platform.
Data correspond to usage on the plateform after 2015. The current usage metrics is available 48-96 hours after online publication and is updated daily on week days.
Initial download of the metrics may take a while.