Fig. 3.
Download original image
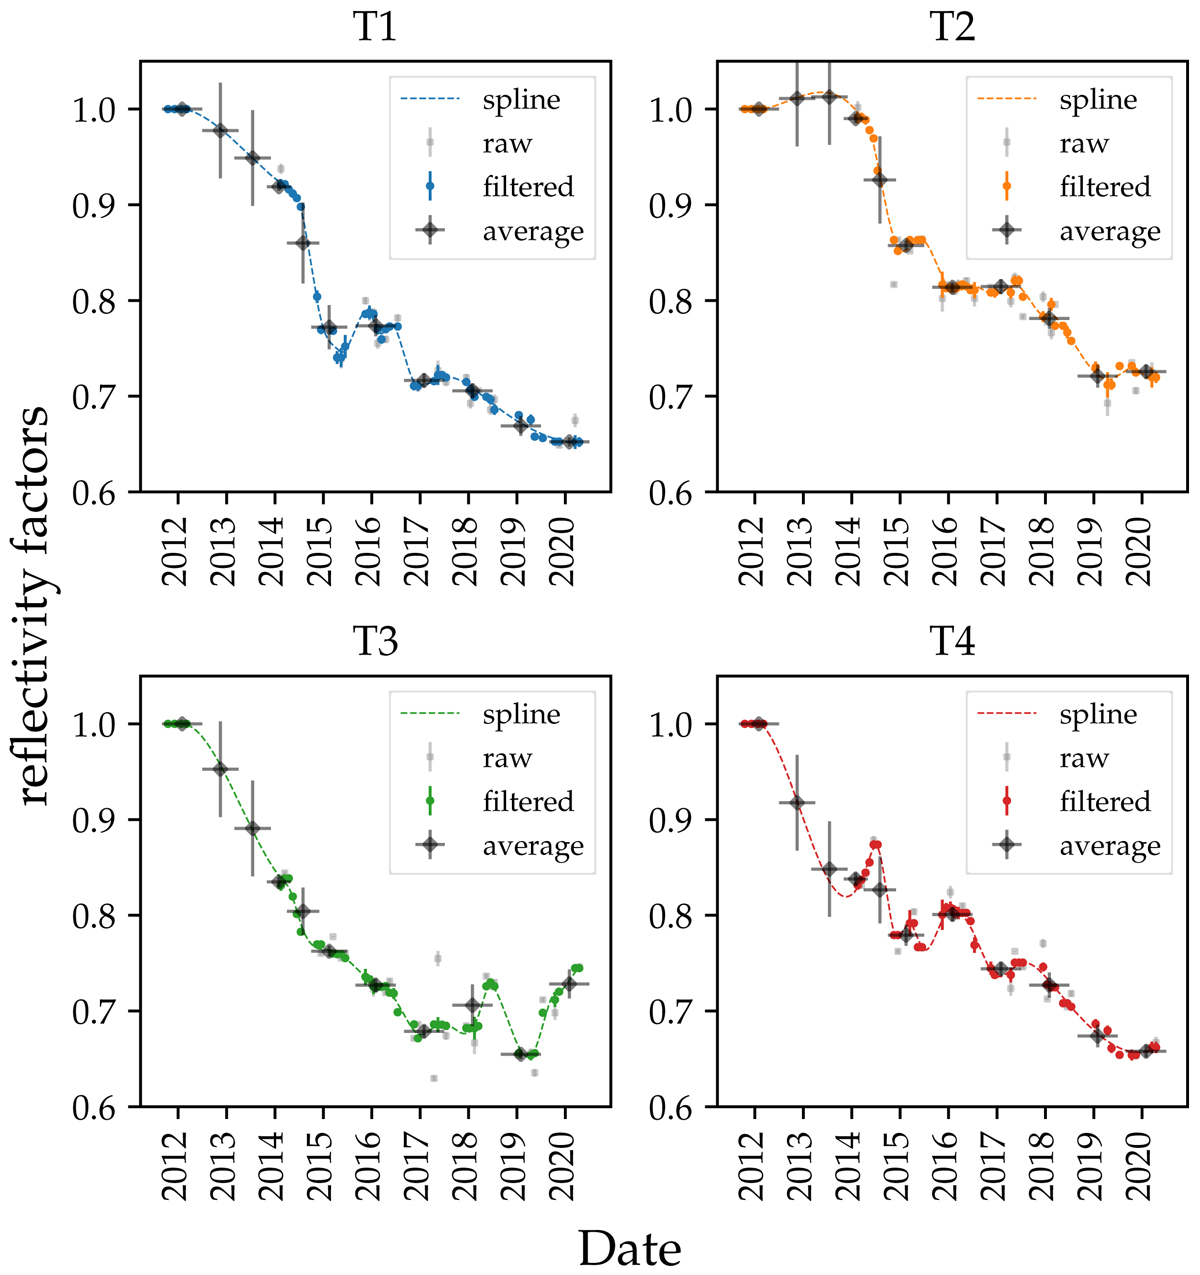
Time-dependent changes of the reflectivity factors obtained from WDR measurements. Black points show the average reflectivity factors for each instrument epoch. Blue, orange, green, and red points show the individual reflectivity factor measurements for each telescope. Curves of the same colors represent a spline interpolation, which removes outliers. The first point (early 2012) is extracted from the simulations and it serves as the reference for the calculation of the reflectivity factors, therefore adopting a value of 1 as reflectivity factor. We note that a value of the reflectivity factor slightly greater than 1 just means that the reflectivity at that time was slightly higher than at the time where simulations were produced.
Current usage metrics show cumulative count of Article Views (full-text article views including HTML views, PDF and ePub downloads, according to the available data) and Abstracts Views on Vision4Press platform.
Data correspond to usage on the plateform after 2015. The current usage metrics is available 48-96 hours after online publication and is updated daily on week days.
Initial download of the metrics may take a while.