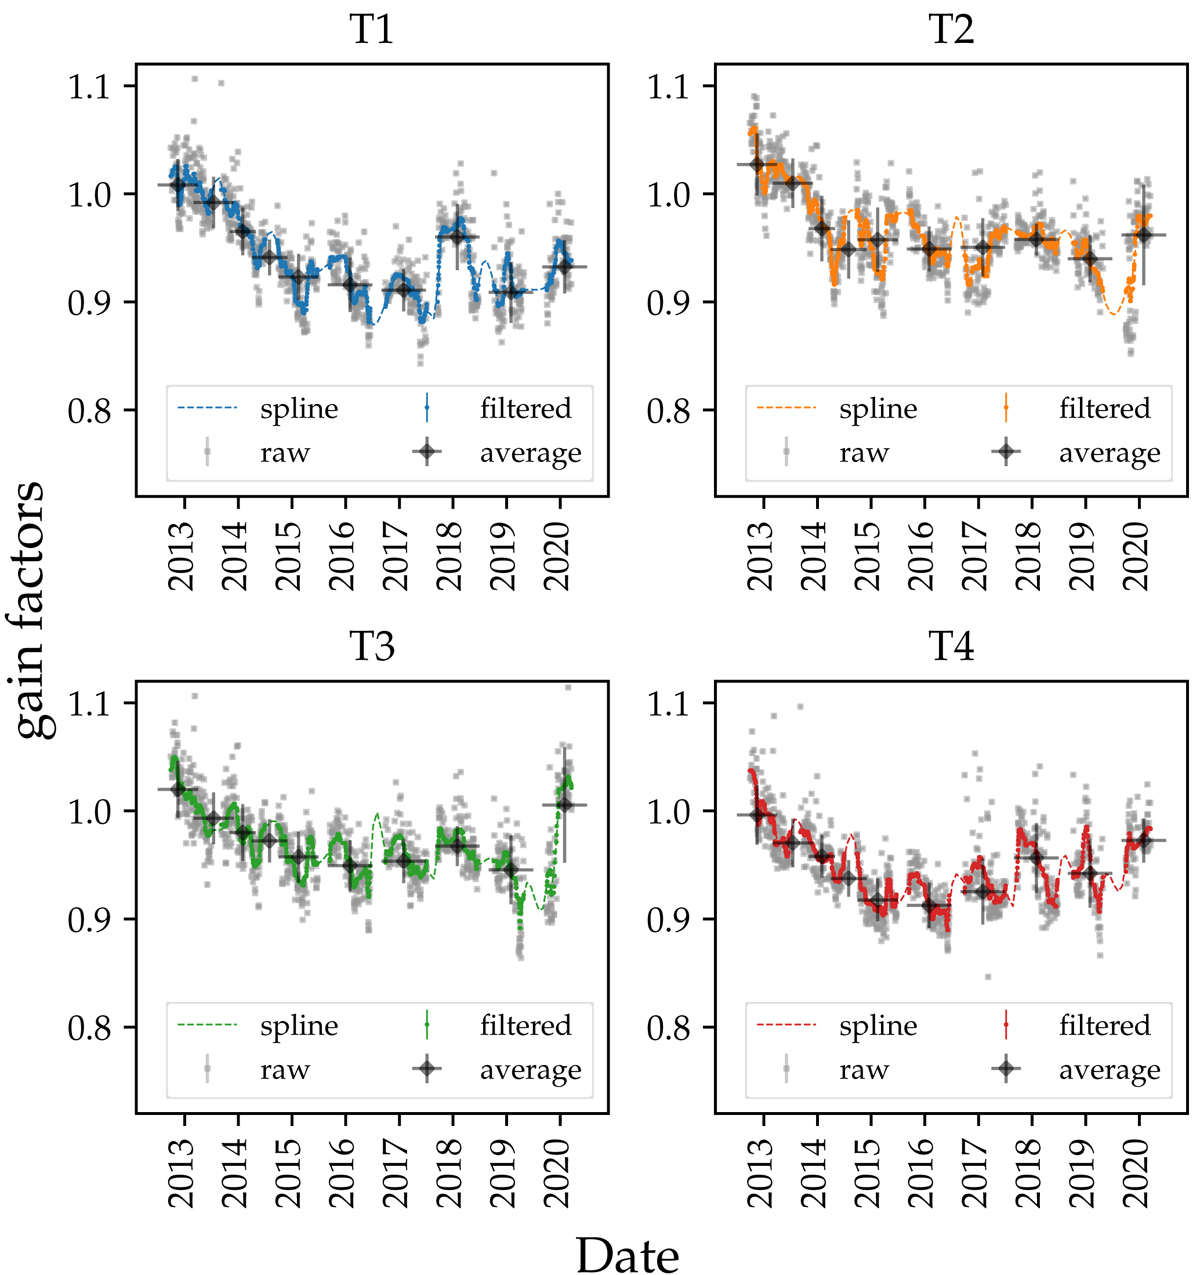
Fig. 2.
Download original image
Time-dependent changes of photo-statistic gains normalized to the nominal absolute gains used in the baseline MC model for the current detector model. This detector model was constructed in 2012, and reproduces the characteristics of VERITAS after the PMT camera upgrade. Black points show the average gain factors for each instrument epoch. Gray points show the individual unfiltered gain factor values per telescope and daily flasher run. Blue, orange, green and red points show the result of a median filter of the individual gain factors. Curves of the same colors represent a spline interpolation of the filtered values. Even though spline interpolation can locally diverge when there is no data available, we note that this occurs only during Summer breaks, where no data is taken in VERITAS, therefore it is not a concern for this study. Error bars represent statistical uncertainties.
Current usage metrics show cumulative count of Article Views (full-text article views including HTML views, PDF and ePub downloads, according to the available data) and Abstracts Views on Vision4Press platform.
Data correspond to usage on the plateform after 2015. The current usage metrics is available 48-96 hours after online publication and is updated daily on week days.
Initial download of the metrics may take a while.