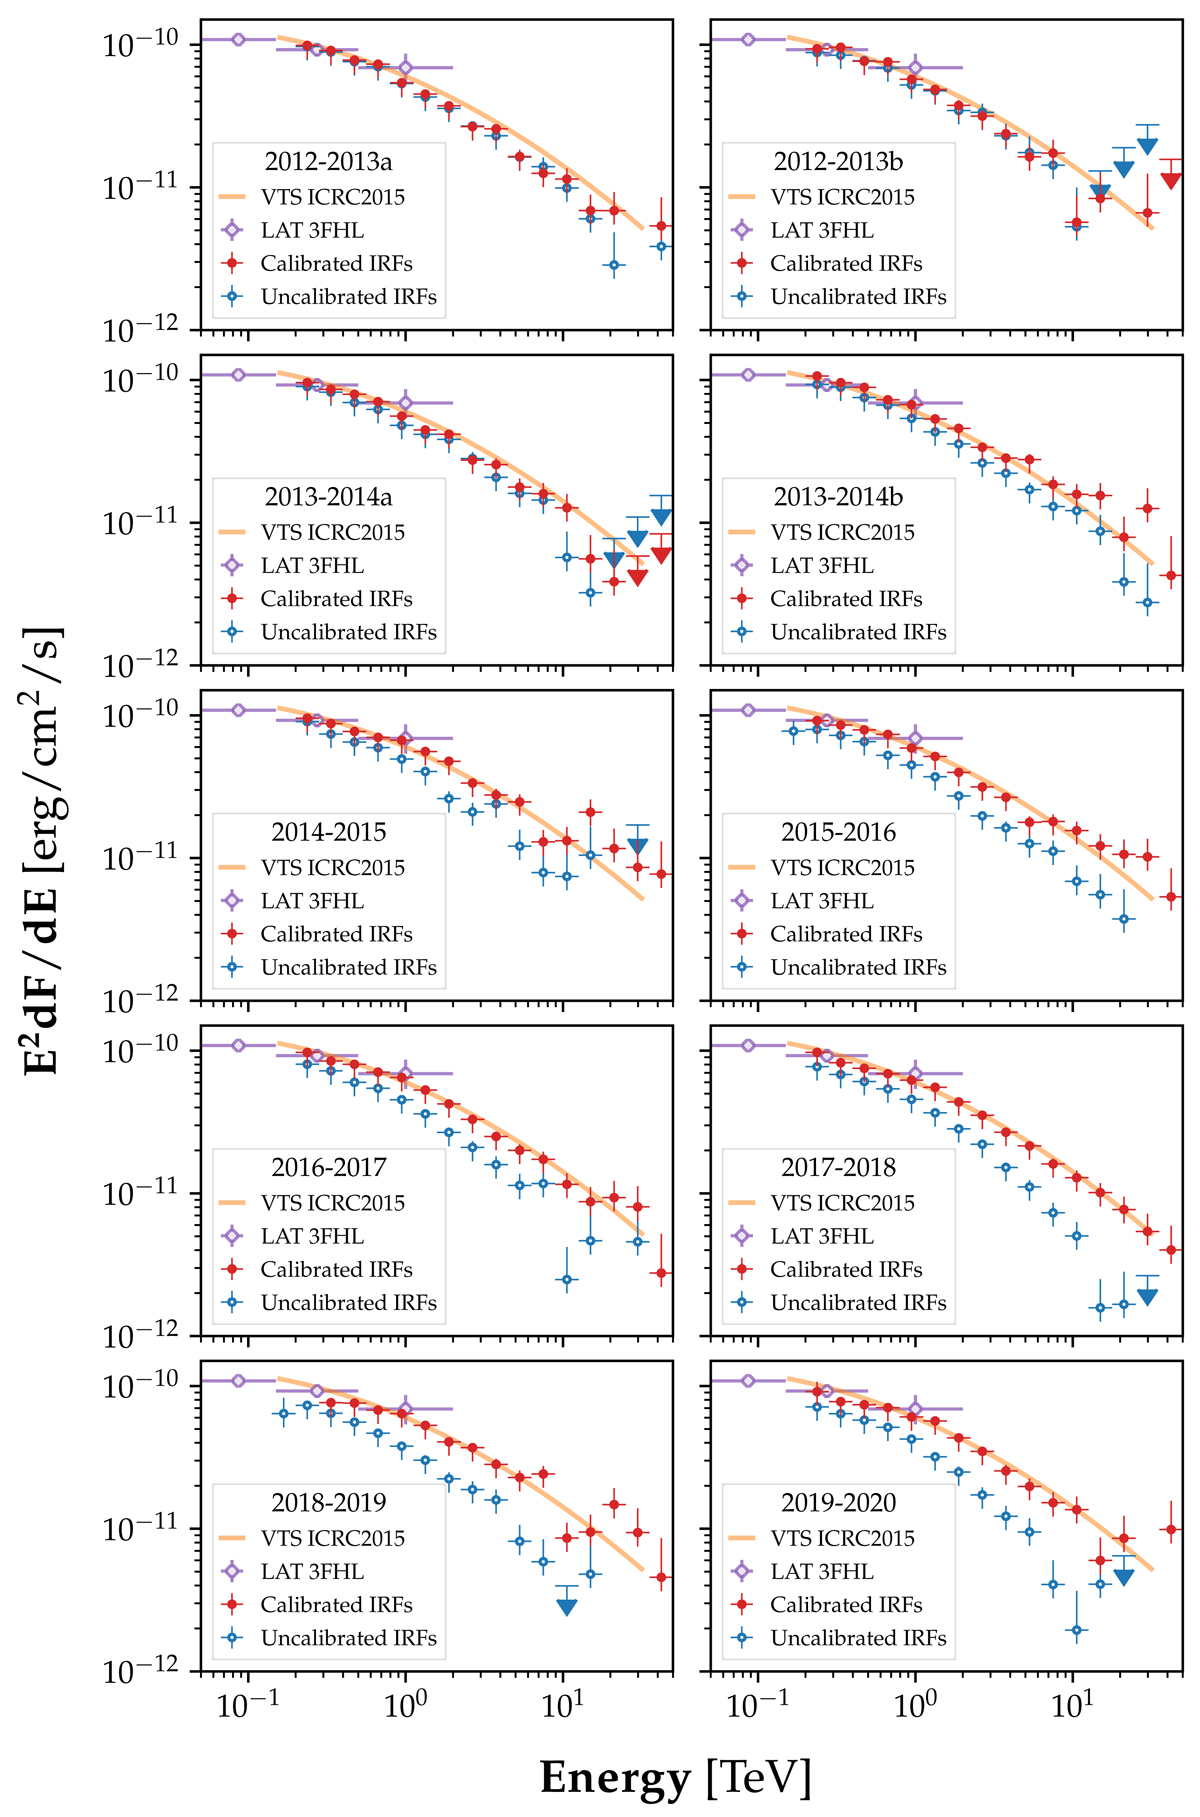
Fig. 15.
Download original image
Collection of spectral energy distributions obtained with moderate cuts for each IRF period. Purple open diamonds represent measurements of the Crab Nebula spectrum from the 3FHL (Ajello et al. 2017), the orange curve shows the Crab Nebula spectrum published by VERITAS in Meagher (2015), open blue points show the fluxes that would be obtained if throughput is not calibrated during the reconstruction of γ-ray showers and instead the MC model from 2012 is employed. Finally, red solid points show the spectral points that are obtained once the pulse signals are calibrated to generate correct IRFs for each period.
Current usage metrics show cumulative count of Article Views (full-text article views including HTML views, PDF and ePub downloads, according to the available data) and Abstracts Views on Vision4Press platform.
Data correspond to usage on the plateform after 2015. The current usage metrics is available 48-96 hours after online publication and is updated daily on week days.
Initial download of the metrics may take a while.