Fig. 13.
Download original image
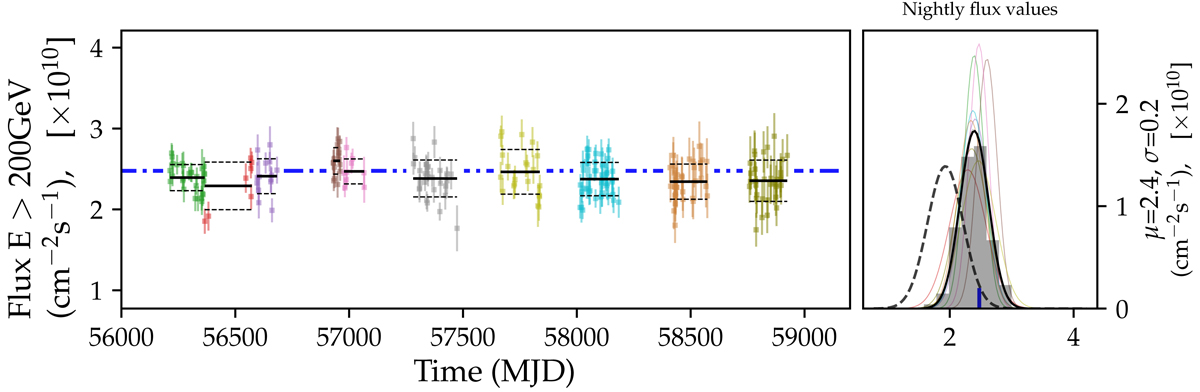
Reconstructed flux of the Crab Nebula above 200 GeV, using 1-day bins and IRFs that correctly match the instrument throughput for each period. Results are obtained applying moderate cuts to runs with mean elevation > 50°. Left panel: each color represents an IRF period. The blue dot-dashed curve represents the reference Crab Nebula spectrum of Meagher (2015) integrated above 200 GeV, horizontal solid black lines represent the season-average fluxes, while dashed horizontal curves show the standard deviation of the fluxes for each season. Right panel: shown in gray is the distribution of fluxes for all seasons combined, with a fit to a Gaussian shape as a solid black line. The dashed black curve shows the equivalent result when throughput changes are not taken into account in the IRFs. The vertical blue dashed line shows the reference Crab Nebula flux from Meagher (2015).
Current usage metrics show cumulative count of Article Views (full-text article views including HTML views, PDF and ePub downloads, according to the available data) and Abstracts Views on Vision4Press platform.
Data correspond to usage on the plateform after 2015. The current usage metrics is available 48-96 hours after online publication and is updated daily on week days.
Initial download of the metrics may take a while.