Fig. 6.
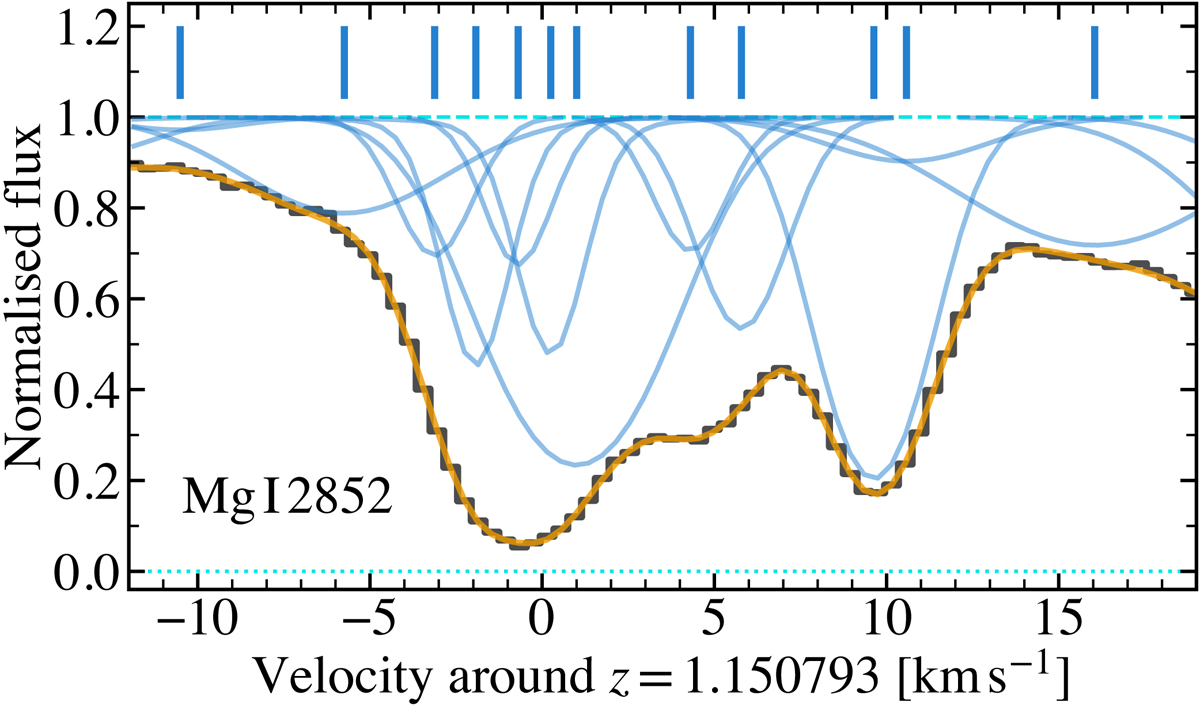
Download original image
Detailed Mg I λ2852 velocity structure showing the very narrow components near 0 km s−1 in the right region. The model fit (solid orange line) overlays the spectrum (black histogram) and the Voigt profiles of individual components are shown in thin blue lines, with tick marks above the spectrum indicating their centroids. In our fiducial fit shown here, the components at ≈ − 2 and 0 km s−1 have best-fit b parameters of just 0.29 ± 0.07 and 0.22 ± 0.13 km s−1.
Current usage metrics show cumulative count of Article Views (full-text article views including HTML views, PDF and ePub downloads, according to the available data) and Abstracts Views on Vision4Press platform.
Data correspond to usage on the plateform after 2015. The current usage metrics is available 48-96 hours after online publication and is updated daily on week days.
Initial download of the metrics may take a while.