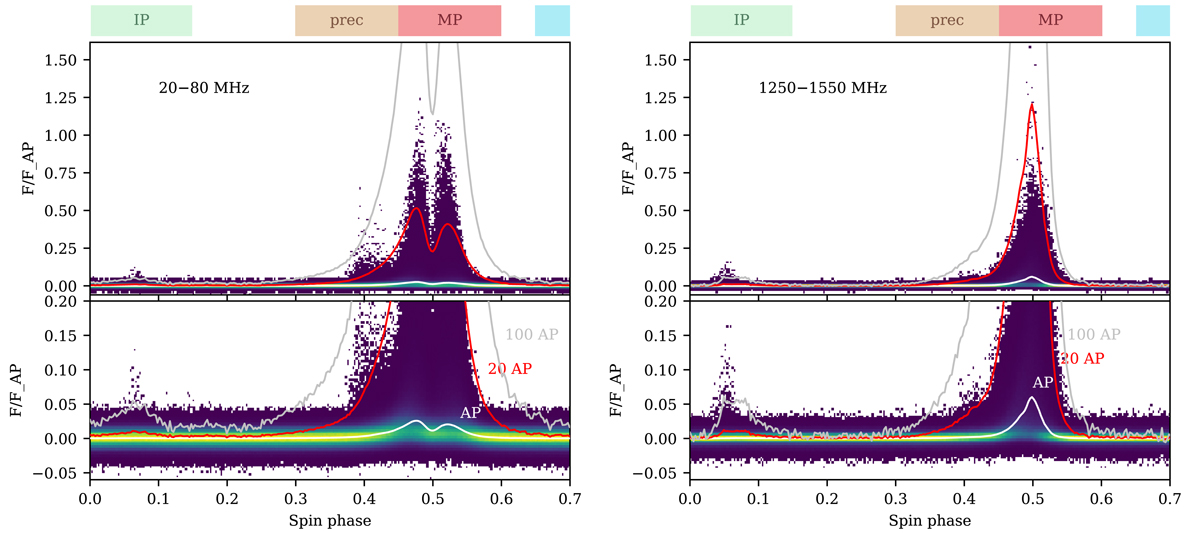
Fig. 4.
Download original image
Longitude-resolved fluence distributions per ≈650 μs, normalized by the average period-integrated fluence for each observing session. On 2D histogram, lighter colors correspond to larger number of counts in the given (phase × fluence) bin, with the darkest color corresponding to one count. The average phase-resolved fluence and its 20× and 100× multiplicatives are shown by white, red and gray lines, respectively. Spin phases beyond 0.7 are not shown.
Current usage metrics show cumulative count of Article Views (full-text article views including HTML views, PDF and ePub downloads, according to the available data) and Abstracts Views on Vision4Press platform.
Data correspond to usage on the plateform after 2015. The current usage metrics is available 48-96 hours after online publication and is updated daily on week days.
Initial download of the metrics may take a while.