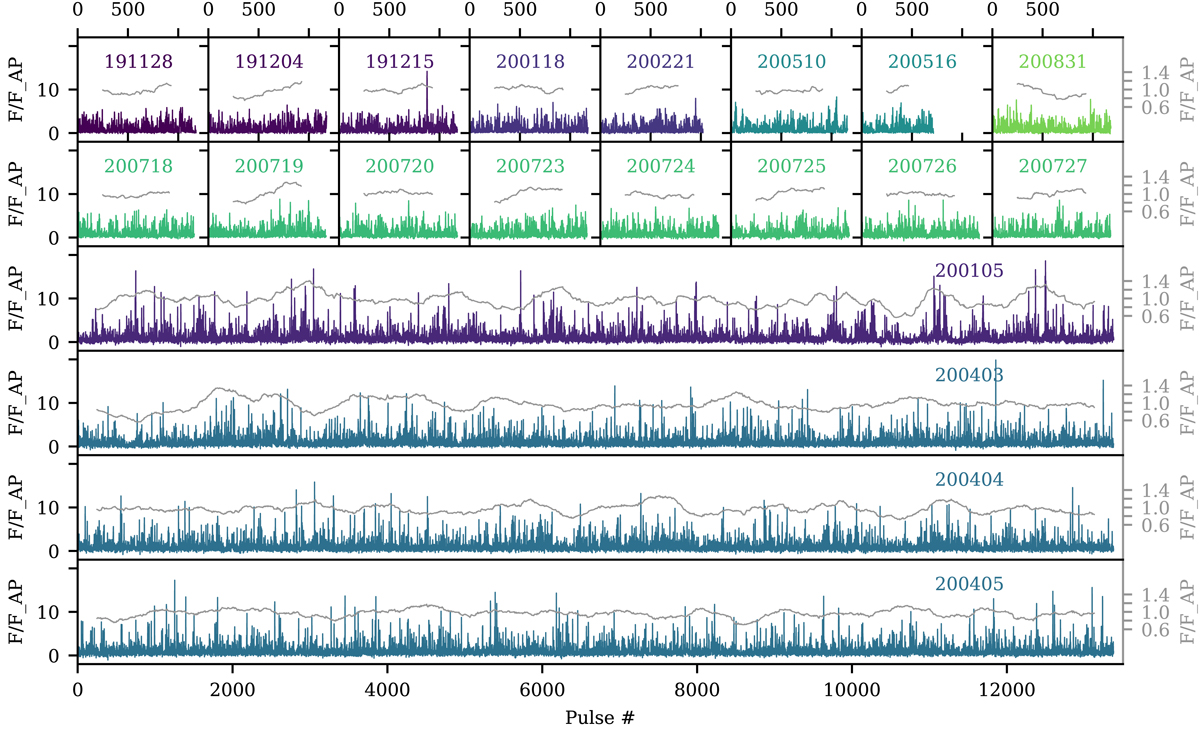
Fig. 2.
Download original image
Single-pulse fluences integrated within MP, precursor, and IP regions combined. The top two rows show L-band observations; the others correspond to the VHF sessions. Color encodes the epoch of observation, varying smoothly between darker blue (first session, November 2019) to lighter green (last session, August 2020). Grey lines mark the rolling 500-pulse average, with corresponding fluence scale displayed on the right. The observing date is noted for each session, in yymmdd format.
Current usage metrics show cumulative count of Article Views (full-text article views including HTML views, PDF and ePub downloads, according to the available data) and Abstracts Views on Vision4Press platform.
Data correspond to usage on the plateform after 2015. The current usage metrics is available 48-96 hours after online publication and is updated daily on week days.
Initial download of the metrics may take a while.