Fig. 16.
Download original image
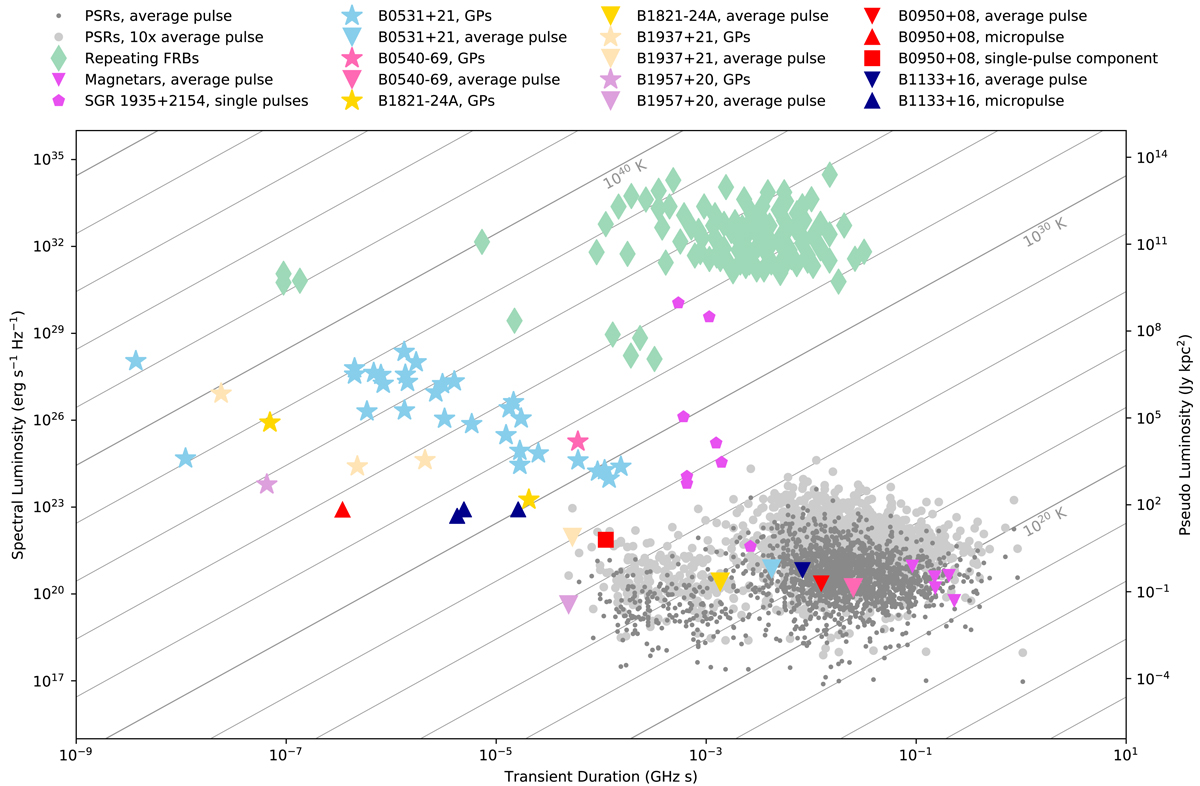
Time-luminosity phase-space plot for radio pulses from neutron stars and repeating FRBs showing the product of observing frequency and pulse width (νW in GHz s) against equivalent isotropic spectral luminosity (4πSpeakd2, left) and the pseudoluminosity (Speakd2, right). The brightness temperature Tb = (1/2kb)×(Speakd2)/(νW)2 is indicated by gray lines. Black dots show pulsar spectral luminosity calculated from continuum flux density at 1400 MHz, with pulse duration assumed to be full width at half maximum of the average profile at the same frequency (ATNF pulsar catalog v.1.64 Manchester et al. 2005) or 0.04P if no such value was given in the catalog. Lighter dots mark common single-pulse fluence variability at 10× the average pulse luminosity. Light green diamonds show FRBs from repeating sources with known distances (FRB 20121102A, FRB 20180916B, FRB 20190711A, FRB 20200120E see Nimmo et al. (2021), and references therein). Purple pentagon mark individual bursts from magnetar SGR 1935+2154 taken from compilation by Nimmo et al. (2021), and the downward triangles indicate the average pulse luminosities from the neutron stars with surface magnetic field larger than 5 × 10¹³ G in the ATNF catalog. Stars show representative GPs or their components from the studies where both peak flux density and widths were measured, with the latter not biased by scattering (but still possibly below time resolution). Light blue color marks the Crab pulsar (Hankins et al. 2003; Hankins & Eilek 2007; Karuppusamy et al. 2010; Popov et al. 2009; Bera & Chengalur 2019; Bhat et al. 2008), beige corresponds to PSR B1937+21 (Kinkhabwala & Thorsett 2000; Soglasnov et al. 2004; McKee et al. 2019), yellow to PSR B1821-24A (Knight et al. 2006; Bilous et al. 2015), pink to PSR B0540-69 (Geyer et al. 2021), and light violet to PSR B1957+21 (Main et al. 2017). Finally, upward red triangle shows unresolved microstructure component for PSR B0950+08 from Hankins & Boriakoff (1978). Blue upward triangles mark strong microcomponents from a pulse from another ordinary nearby PSR B1133+16 (Bartel 1978; Bartel & Hankins 1982). The brightest unresolved component for our L-band observation of PSR B0950+08 is shown with the red square (see text for details). Downward triangles of corresponding colors show the average pulses from the respective pulsars.
Current usage metrics show cumulative count of Article Views (full-text article views including HTML views, PDF and ePub downloads, according to the available data) and Abstracts Views on Vision4Press platform.
Data correspond to usage on the plateform after 2015. The current usage metrics is available 48-96 hours after online publication and is updated daily on week days.
Initial download of the metrics may take a while.