Fig. 15.
Download original image
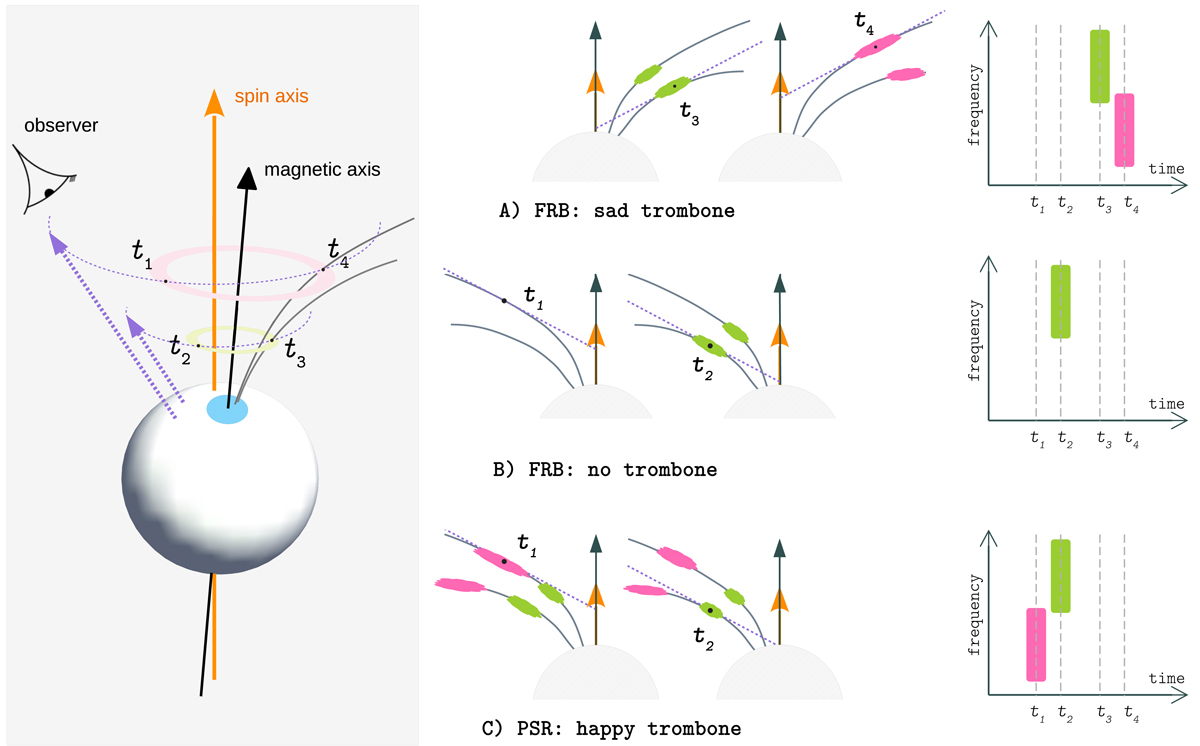
Cartoon model of the frequency drift in subpulse components in pulsars and FRBs from the radius-to-frequency mapping of emission from separate plasma clumps propagating in neutron star magnetosphere (Wang et al. 2019). The inset on the left side shows neutron star with magnetic dipole axis (black arrow) inclined with respect to the spin axis (orange arrow). The light blue circle on the surface of the star shows the footpoints of the open field lines, with a couple of field lines drawn as an example. Purple dashed arrows indicate LOS direction. Following classical radius-to-frequency mapping, radio waves are emitted tangentially to the field line, with higher frequencies coming from smaller altitudes. The emission is postulated to come from a ring of field lines with the same magnetic collatitude. As pulsar rotates, the observer detects emission from a range altitudes at the moments of time t1−4 (black dots). In the center column the 2D projection of the same setup is shown with magnetic dipole axis lying in the picture plane and the spin axis pointing up and away from the reader. The line of sight (LOS) at t1−2 or t3−4 is indicated by the dotted line. Pulse spectra are plotted in the rightmost column. In all three rows some event generates clumps of plasma simultaneously on two separate field lines. These clumps are moving along the field lines emitting radio waves with altitude-dependent radio frequency. For the row (A) LOS fortuitously aligns with radio emission from one clump at higher radio frequency, and, shortly afterward, with another clump at lower frequency, resulting in the “sad trombone” spectrum. For (B) the same scenario is shown for the leading part of the profile. In this case the clump is not there yet when LOS passes through outer magnetic field line, resulting in single-component “no trombone” spectrum. For pulsars (C) clumps are supposed to be much more frequent (but still distinct), so LOS crosses beams of radio waves from two different batches of clumps, generating upward frequency drift, a.k.a. “happy trombone”.
Current usage metrics show cumulative count of Article Views (full-text article views including HTML views, PDF and ePub downloads, according to the available data) and Abstracts Views on Vision4Press platform.
Data correspond to usage on the plateform after 2015. The current usage metrics is available 48-96 hours after online publication and is updated daily on week days.
Initial download of the metrics may take a while.