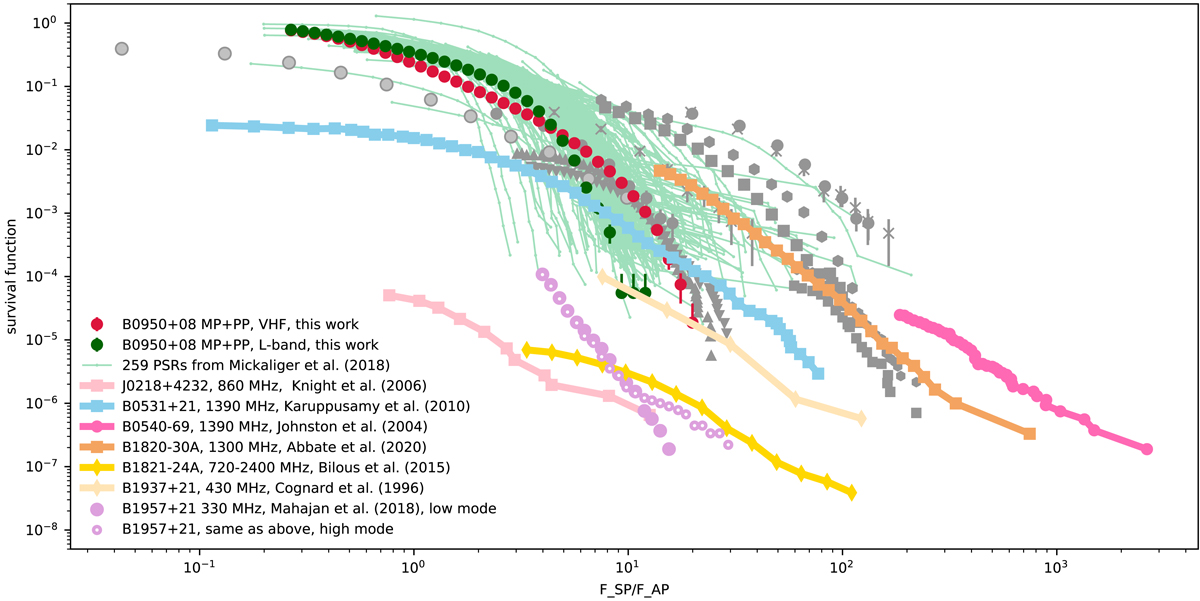
Fig. 13.
Download original image
Comparison of PSR B0950+08’s MP+precursor fluence distribution to the sample of normal pulsars from Mickaliger et al. (2018, light green lines) and the collection of “classical” GPs normalized to FAP (colored lines). Other measurements of the PSR B0950+08 single-pulse fluence distributions from Fig. 10 are given in gray (using the same markers as in that Figure).
Current usage metrics show cumulative count of Article Views (full-text article views including HTML views, PDF and ePub downloads, according to the available data) and Abstracts Views on Vision4Press platform.
Data correspond to usage on the plateform after 2015. The current usage metrics is available 48-96 hours after online publication and is updated daily on week days.
Initial download of the metrics may take a while.