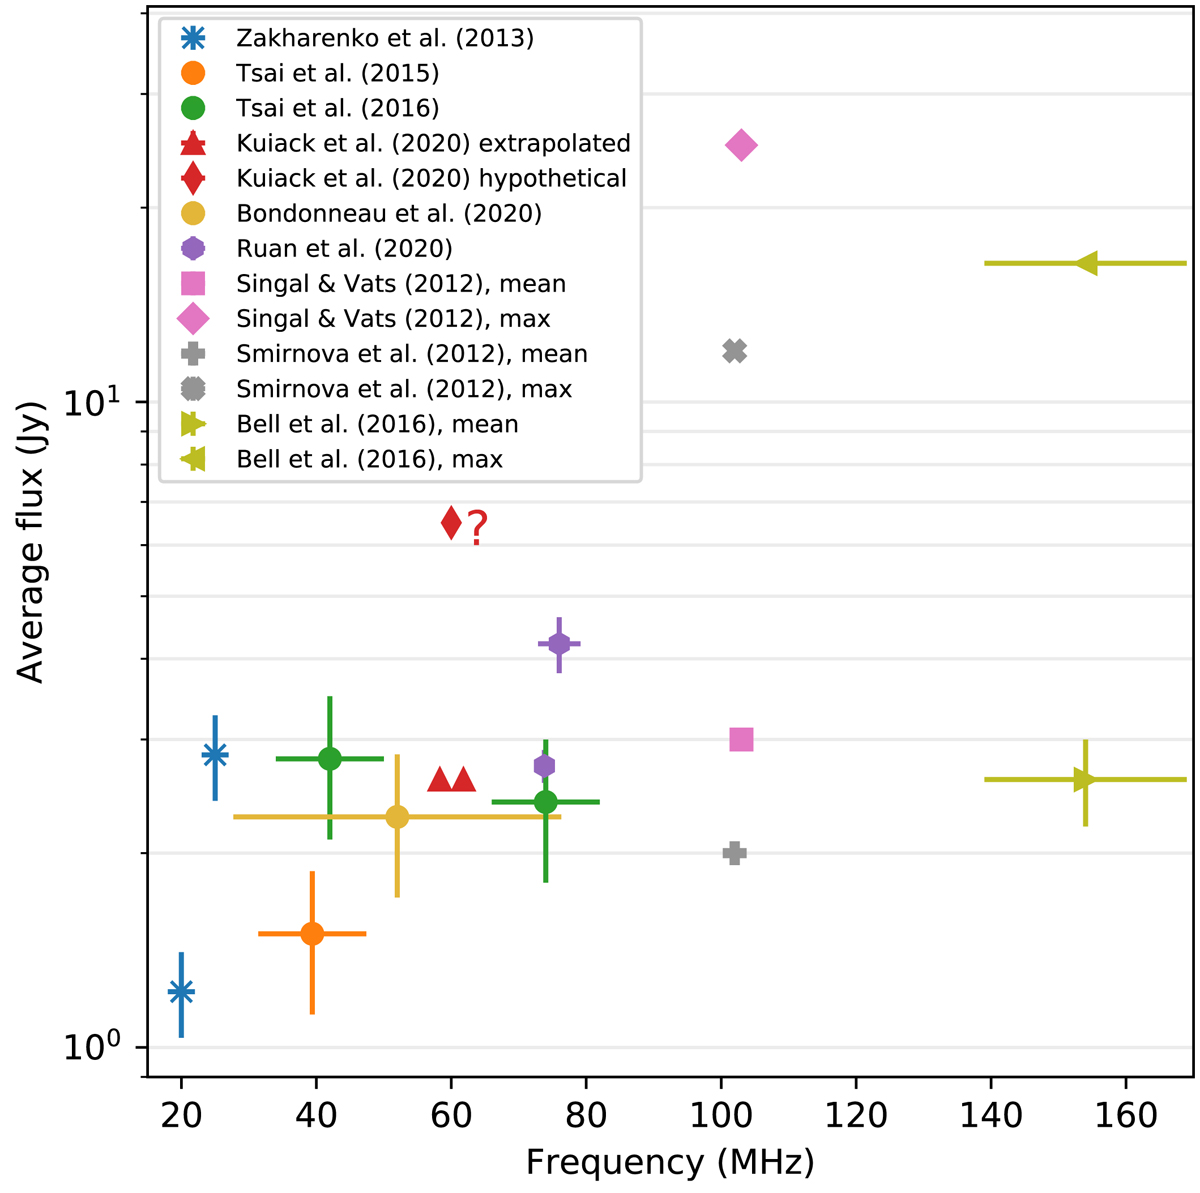
Fig. 12.
Download original image
Average flux density spectrum for PSR B0950+08 constructed from the literature with uncertainties given by the authors (Zakharenko et al. 2013; Tsai et al. 2015, 2016; Bondonneau et al. 2020; Ruan et al. 2020; Singal & Vats 2012; Smirnova & Shishov 2008; Bell et al. 2016). The horizontal errorbars indicate bandwidth. For observations at frequencies higher than 100 MHz both mean and maximum fluxes per observing campaign are shown. Kuiack et al. (2020) did not measure the average flux density values directly, but extrapolated from Tsai et al. (2016). The question mark points to the conjectured flux density value that would align the single-pulse fluence distribution of Kuiack et al. (2020) with other work (Figs. 10 and 11).
Current usage metrics show cumulative count of Article Views (full-text article views including HTML views, PDF and ePub downloads, according to the available data) and Abstracts Views on Vision4Press platform.
Data correspond to usage on the plateform after 2015. The current usage metrics is available 48-96 hours after online publication and is updated daily on week days.
Initial download of the metrics may take a while.