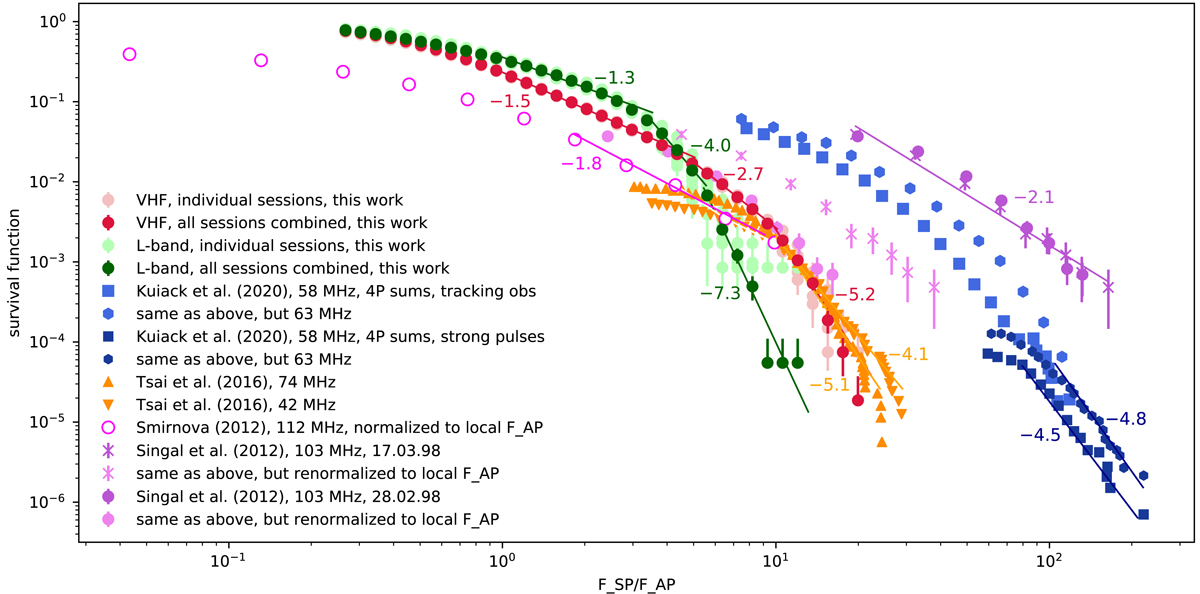
Fig. 10.
Download original image
Survival function of the PSR B0950+08 single-pulse fluence distribution in the MP+precursor phase regions, from our observations and literature. For our observations, dark and light green circles mark the combined distribution in L-band and individual sessions, respectively. Similarly, light and dark red circles show the distributions for the VHF fluences. One-second continuum integrations from Kuiack et al. (2020), equivalent to 4-pulse fluence sums, are shown with blue circles and squares. Orange triangles mark single-pulse fluences from Tsai et al. (2016). Purple circles and squares mark the measurements of Singal & Vats (2012), with lighter shade showing values renormalized to their local average profile fluences. Observations from Smirnova (2012) are shown as unfilled magenta circles. Power-law indices from the literature or this work are given next to the corresponding distributions in matching color.
Current usage metrics show cumulative count of Article Views (full-text article views including HTML views, PDF and ePub downloads, according to the available data) and Abstracts Views on Vision4Press platform.
Data correspond to usage on the plateform after 2015. The current usage metrics is available 48-96 hours after online publication and is updated daily on week days.
Initial download of the metrics may take a while.