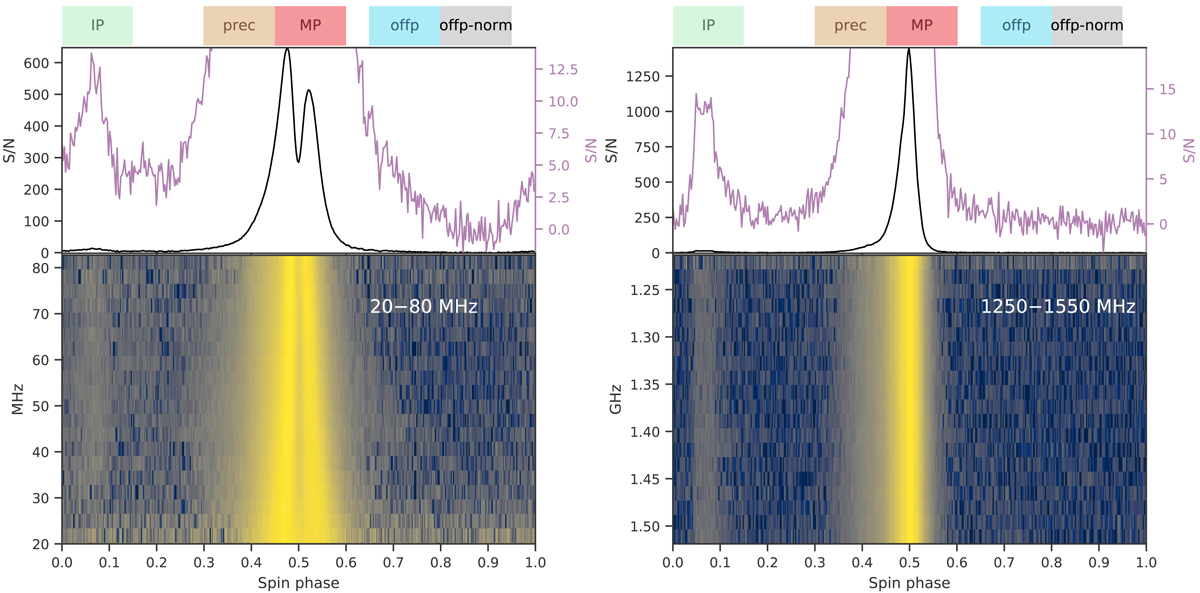
Fig. 1.
Download original image
Average profiles (upper row) and spectra (lower row) of PSR B0950+08 in VHF band (left) and L-band (right). Here, the average profiles are normalized by the mean and standard deviation of the signal in specifically selected “off-pulse-norm” window of the frequency-integrated data. The spectra are normalized by the profile maximum in each frequency subband and the logarithm of the absolute value of the signal is plotted in order to highlight faint spectral features. For the average profiles, the light purple curves show the zoom-in to the low signal-to-noise (S/N). The colored boxes at the top mark the borders of selected phase windows. These cover the interpulse (IP), precursor, main pulse (MP), off-pulse (“offp”) for the noise-induced fluence variability calculations, and another off-pulse window for baseline subtraction (“off-pulse-norm”).
Current usage metrics show cumulative count of Article Views (full-text article views including HTML views, PDF and ePub downloads, according to the available data) and Abstracts Views on Vision4Press platform.
Data correspond to usage on the plateform after 2015. The current usage metrics is available 48-96 hours after online publication and is updated daily on week days.
Initial download of the metrics may take a while.