Free Access
Fig. 3.
Download original image
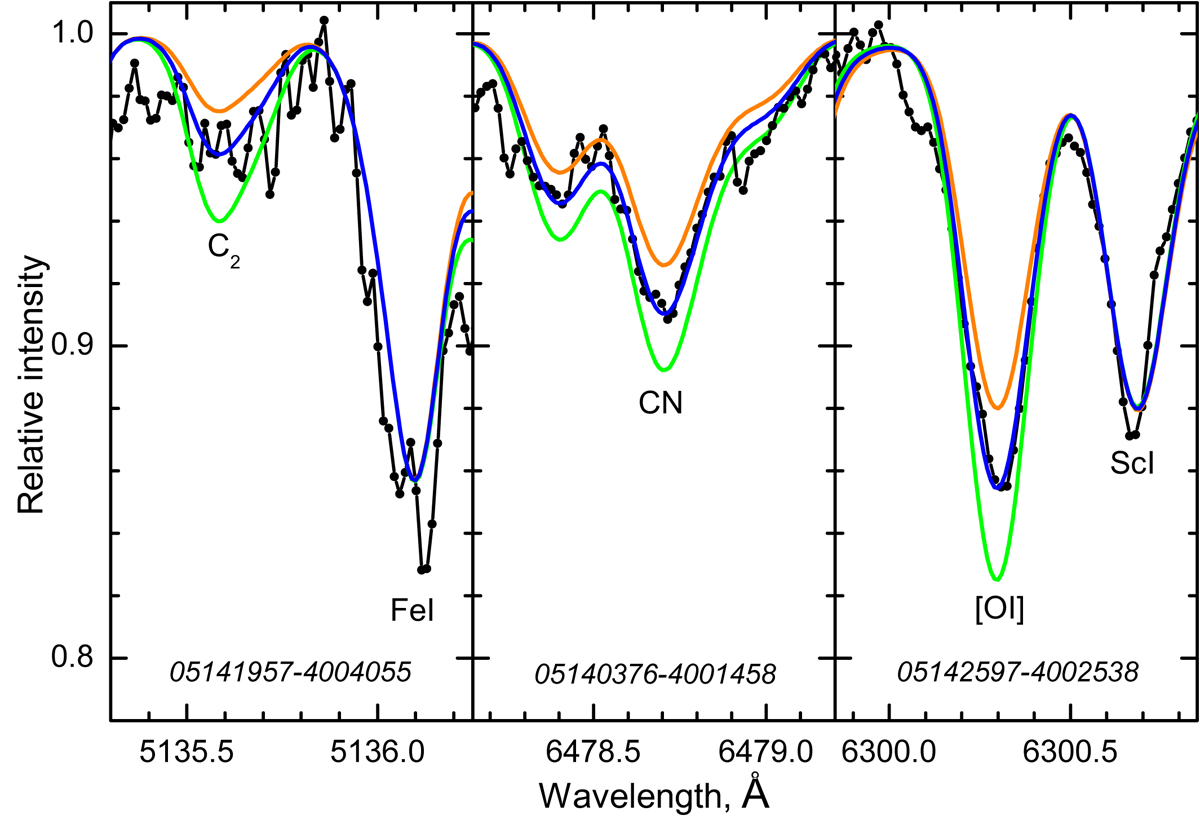
Fits to the C2, CN, and forbidden [O I] line in the spectra of three NGC 1851 stars. The observed spectra are shown as black lines with dots. The best-fit synthetic spectra are the blue lines with ±0.1 dex changes in corresponding abundances shown as orange and green lines.
Current usage metrics show cumulative count of Article Views (full-text article views including HTML views, PDF and ePub downloads, according to the available data) and Abstracts Views on Vision4Press platform.
Data correspond to usage on the plateform after 2015. The current usage metrics is available 48-96 hours after online publication and is updated daily on week days.
Initial download of the metrics may take a while.