Fig. 1.
Download original image
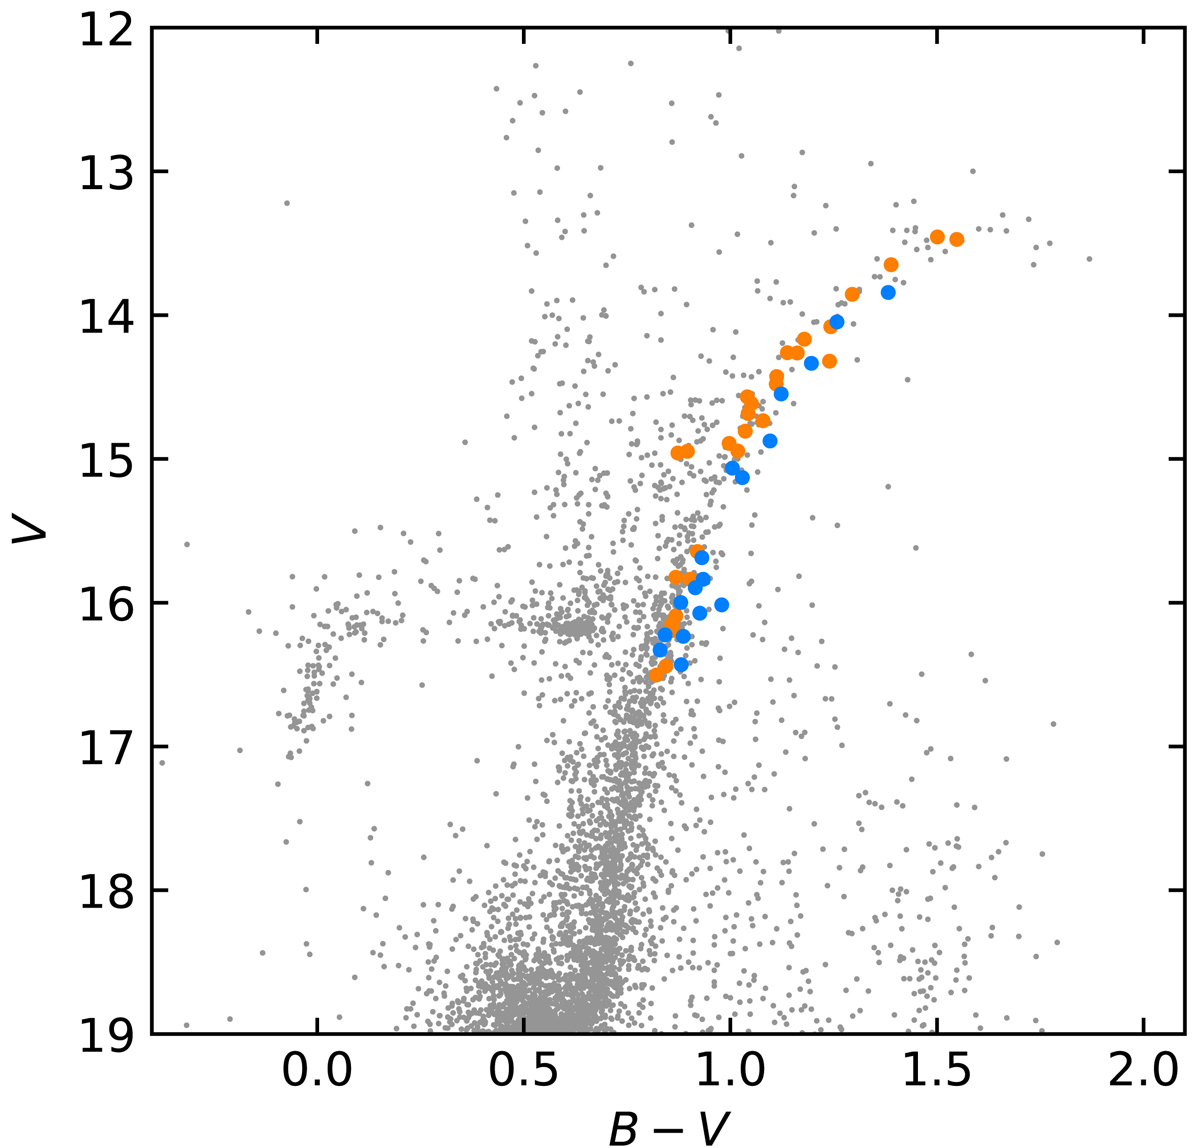
V, B − V colour-magnitude diagram of NGC 1851 (grey circles). Superimposed as larger blue and orange filled circles are the giants investigated in this study. The blue symbols are for the metal-rich subsample stars and the orange symbols are for the metal-poor stars (see the text for the description of how the stars were separated into these subsamples). The photometric data were taken from Stetson et al. (2019); namely, the earlier database version corresponding to the one presented in Monelli et al. (2013).
Current usage metrics show cumulative count of Article Views (full-text article views including HTML views, PDF and ePub downloads, according to the available data) and Abstracts Views on Vision4Press platform.
Data correspond to usage on the plateform after 2015. The current usage metrics is available 48-96 hours after online publication and is updated daily on week days.
Initial download of the metrics may take a while.