Fig. 7
Download original image
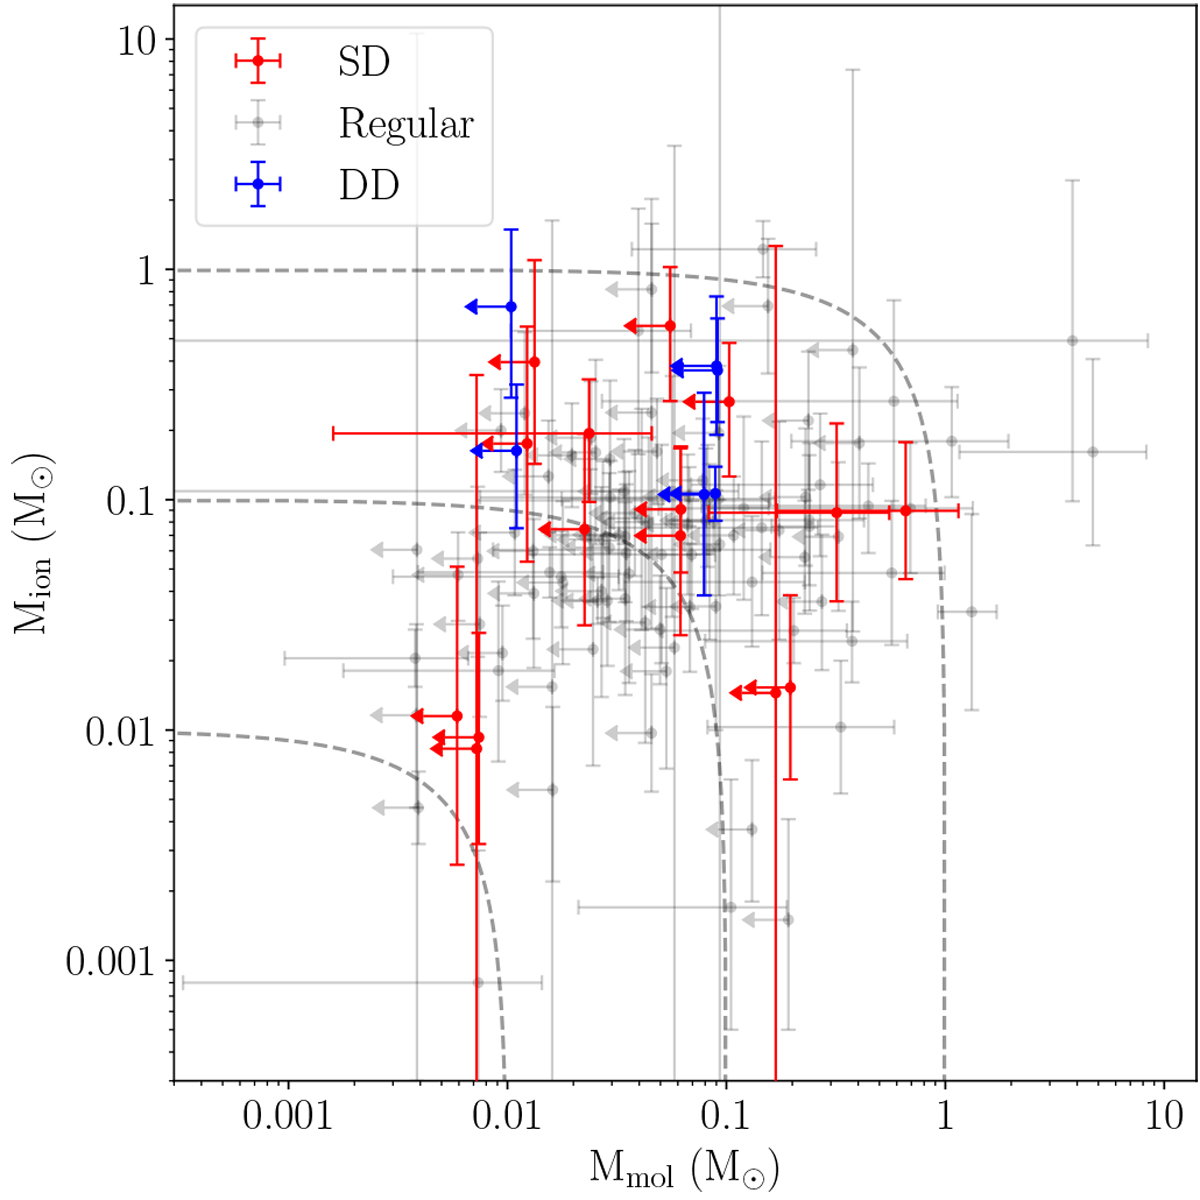
Ionised vs. molecular mass of our post-CE PNe sample and the comparison, regular PNe sample. The further to the top and to the right a nebula is, the more massive it is. Dashed lines represent ‘isomasses’, indicating equal ionised + molecular mass; neglecting neutral atomic mass (see Sect. 4.3), individual nebulae run along these lines as their gas content is progressively ionised.
Current usage metrics show cumulative count of Article Views (full-text article views including HTML views, PDF and ePub downloads, according to the available data) and Abstracts Views on Vision4Press platform.
Data correspond to usage on the plateform after 2015. The current usage metrics is available 48-96 hours after online publication and is updated daily on week days.
Initial download of the metrics may take a while.