Fig. 5
Download original image
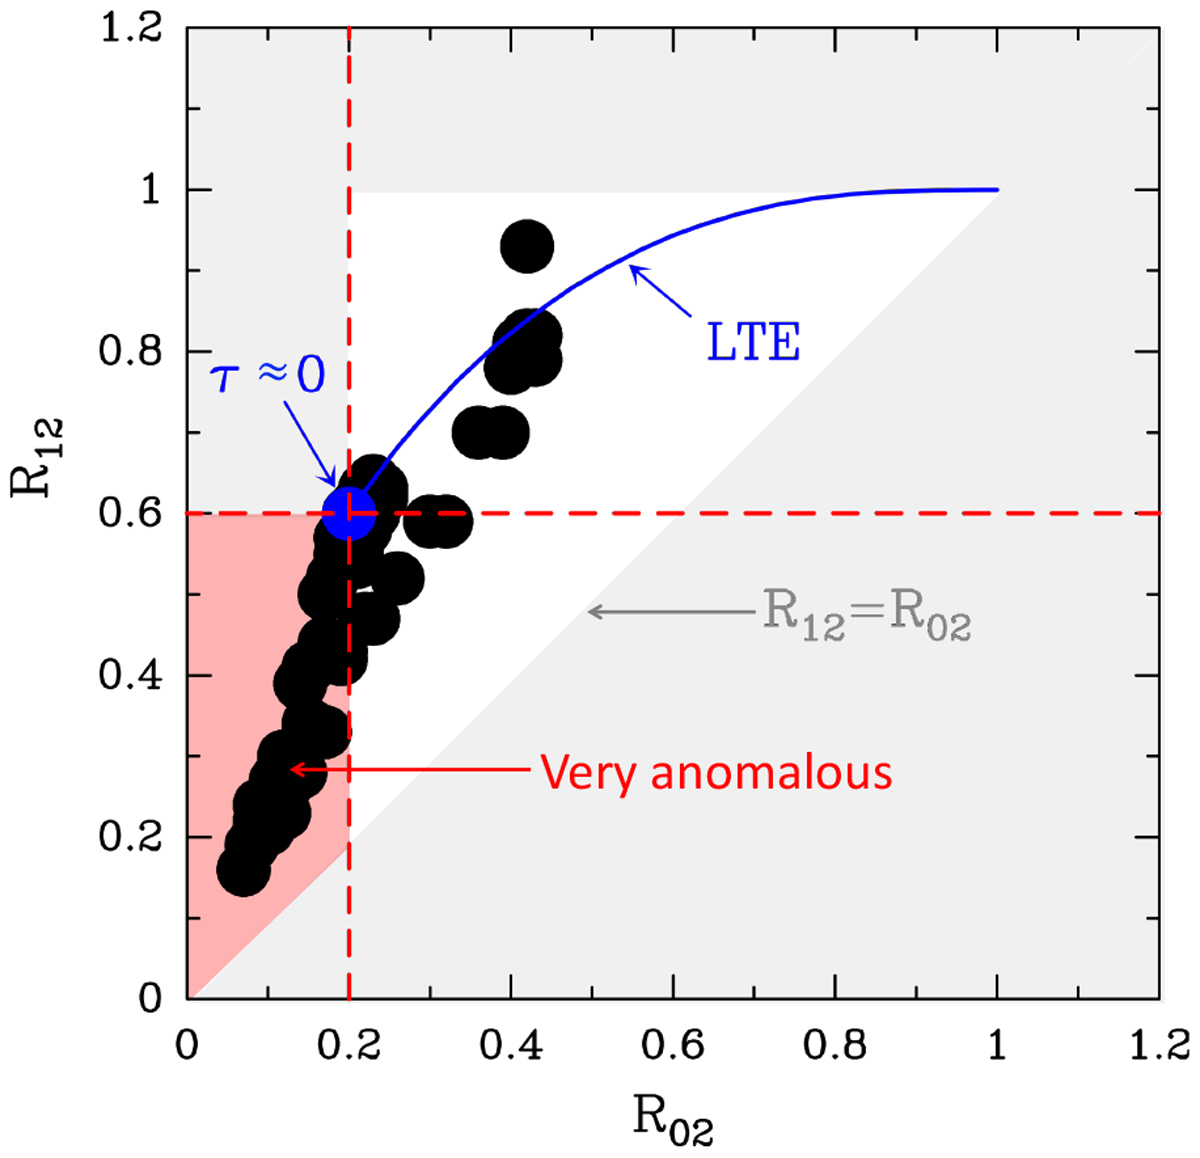
R12 versus R02 from our grid of standard models. The blue curve shows the expected LTE ratios as HCN line opacities increase. The red shaded area shows very anomalous line intensity ratios (R12 < 0.6 and R02 < 0.2). Gray shadedareas show regions of the R12–R02 plane that cannot be explained by single-component static cloud models.
Current usage metrics show cumulative count of Article Views (full-text article views including HTML views, PDF and ePub downloads, according to the available data) and Abstracts Views on Vision4Press platform.
Data correspond to usage on the plateform after 2015. The current usage metrics is available 48-96 hours after online publication and is updated daily on week days.
Initial download of the metrics may take a while.