Fig. 2
Download original image
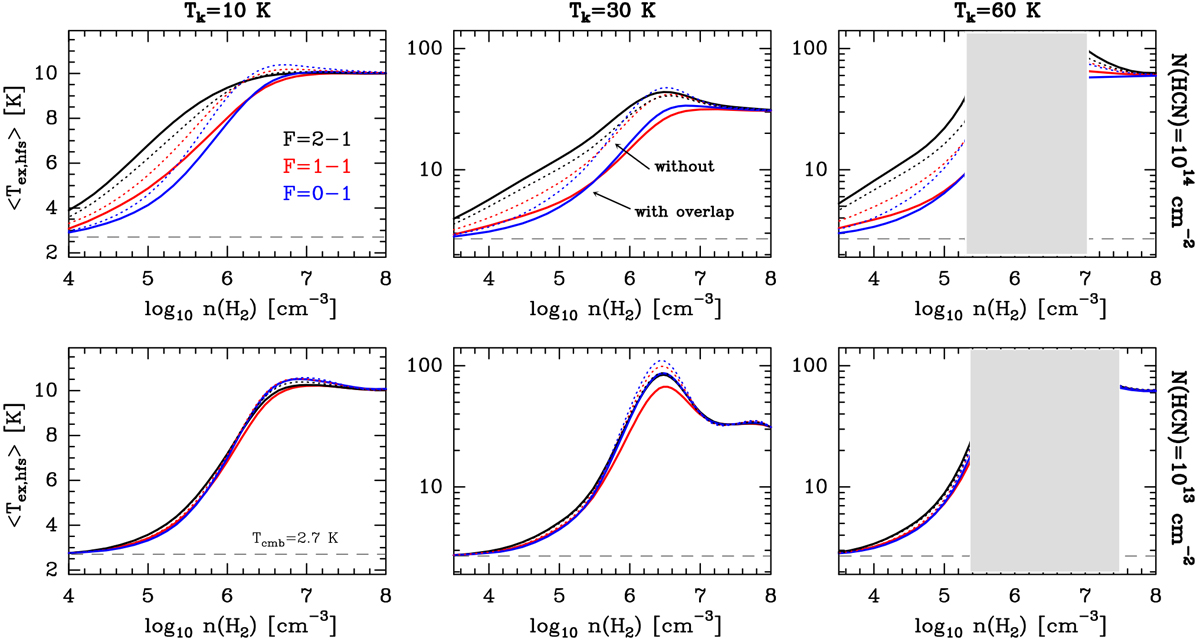
Mean excitation temperature Tex(Fu–Fl) of the three HCN J = 1–0 HFS lines obtained from nonlocal non-LTE models of constant density and temperature clouds with Δvturb = 1 km s−1. N(HCN) is 1014 cm−2 in the upper panels and 1013 cm−2 in the lower panels. Dotted curves show models that neglect line overlaps between different HFS lines. The gray-shaded areas are regions of the parameter space where the excitation is very suprathermal (Tex ≫Tk) or weakly masing (Tex < 0 with small | τ |).
Current usage metrics show cumulative count of Article Views (full-text article views including HTML views, PDF and ePub downloads, according to the available data) and Abstracts Views on Vision4Press platform.
Data correspond to usage on the plateform after 2015. The current usage metrics is available 48-96 hours after online publication and is updated daily on week days.
Initial download of the metrics may take a while.