Fig. 12
Download original image
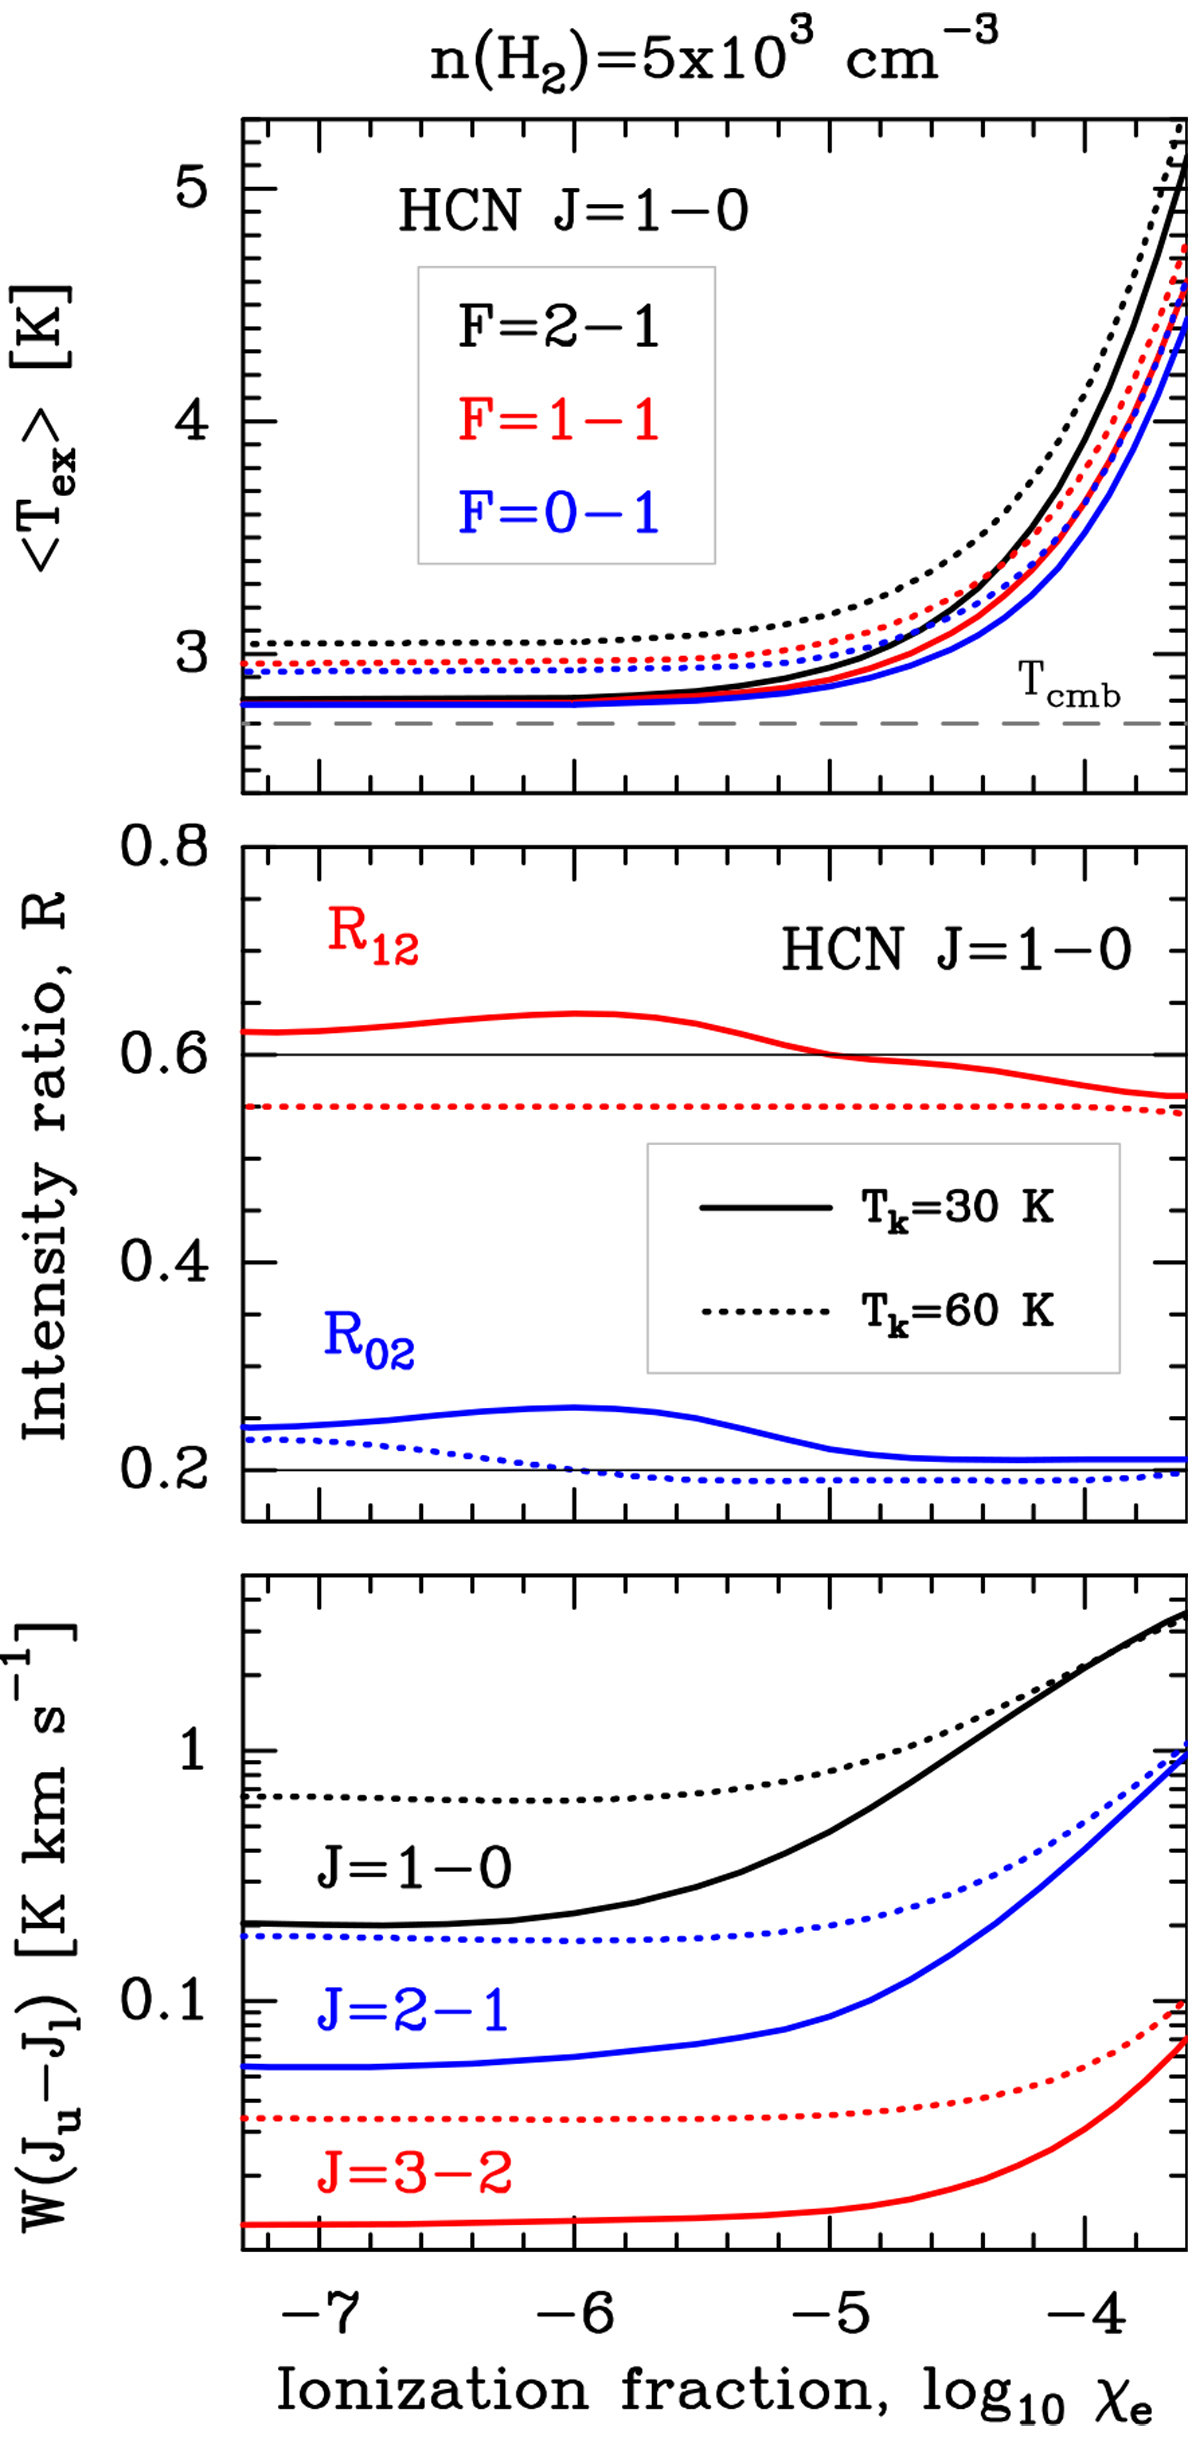
Models of the extended and more translucent environment of GMCs as a function of the ionization fraction. For N(HCN) = 1013 cm−2, and n(H2) = 5 × 103 cm−3 we show: mean Tex(J = 1–0, Fu -Fl) in the upper panel; line intensity ratios R02 and R12 in the middle panel; and total integrated line intensities HCN J = 1–0, 2–1, 3–2 in the lower panel. Continuous and dotted curves show model results for Tk = 30 and 60 K, respectively.
Current usage metrics show cumulative count of Article Views (full-text article views including HTML views, PDF and ePub downloads, according to the available data) and Abstracts Views on Vision4Press platform.
Data correspond to usage on the plateform after 2015. The current usage metrics is available 48-96 hours after online publication and is updated daily on week days.
Initial download of the metrics may take a while.