Fig. 1
Download original image
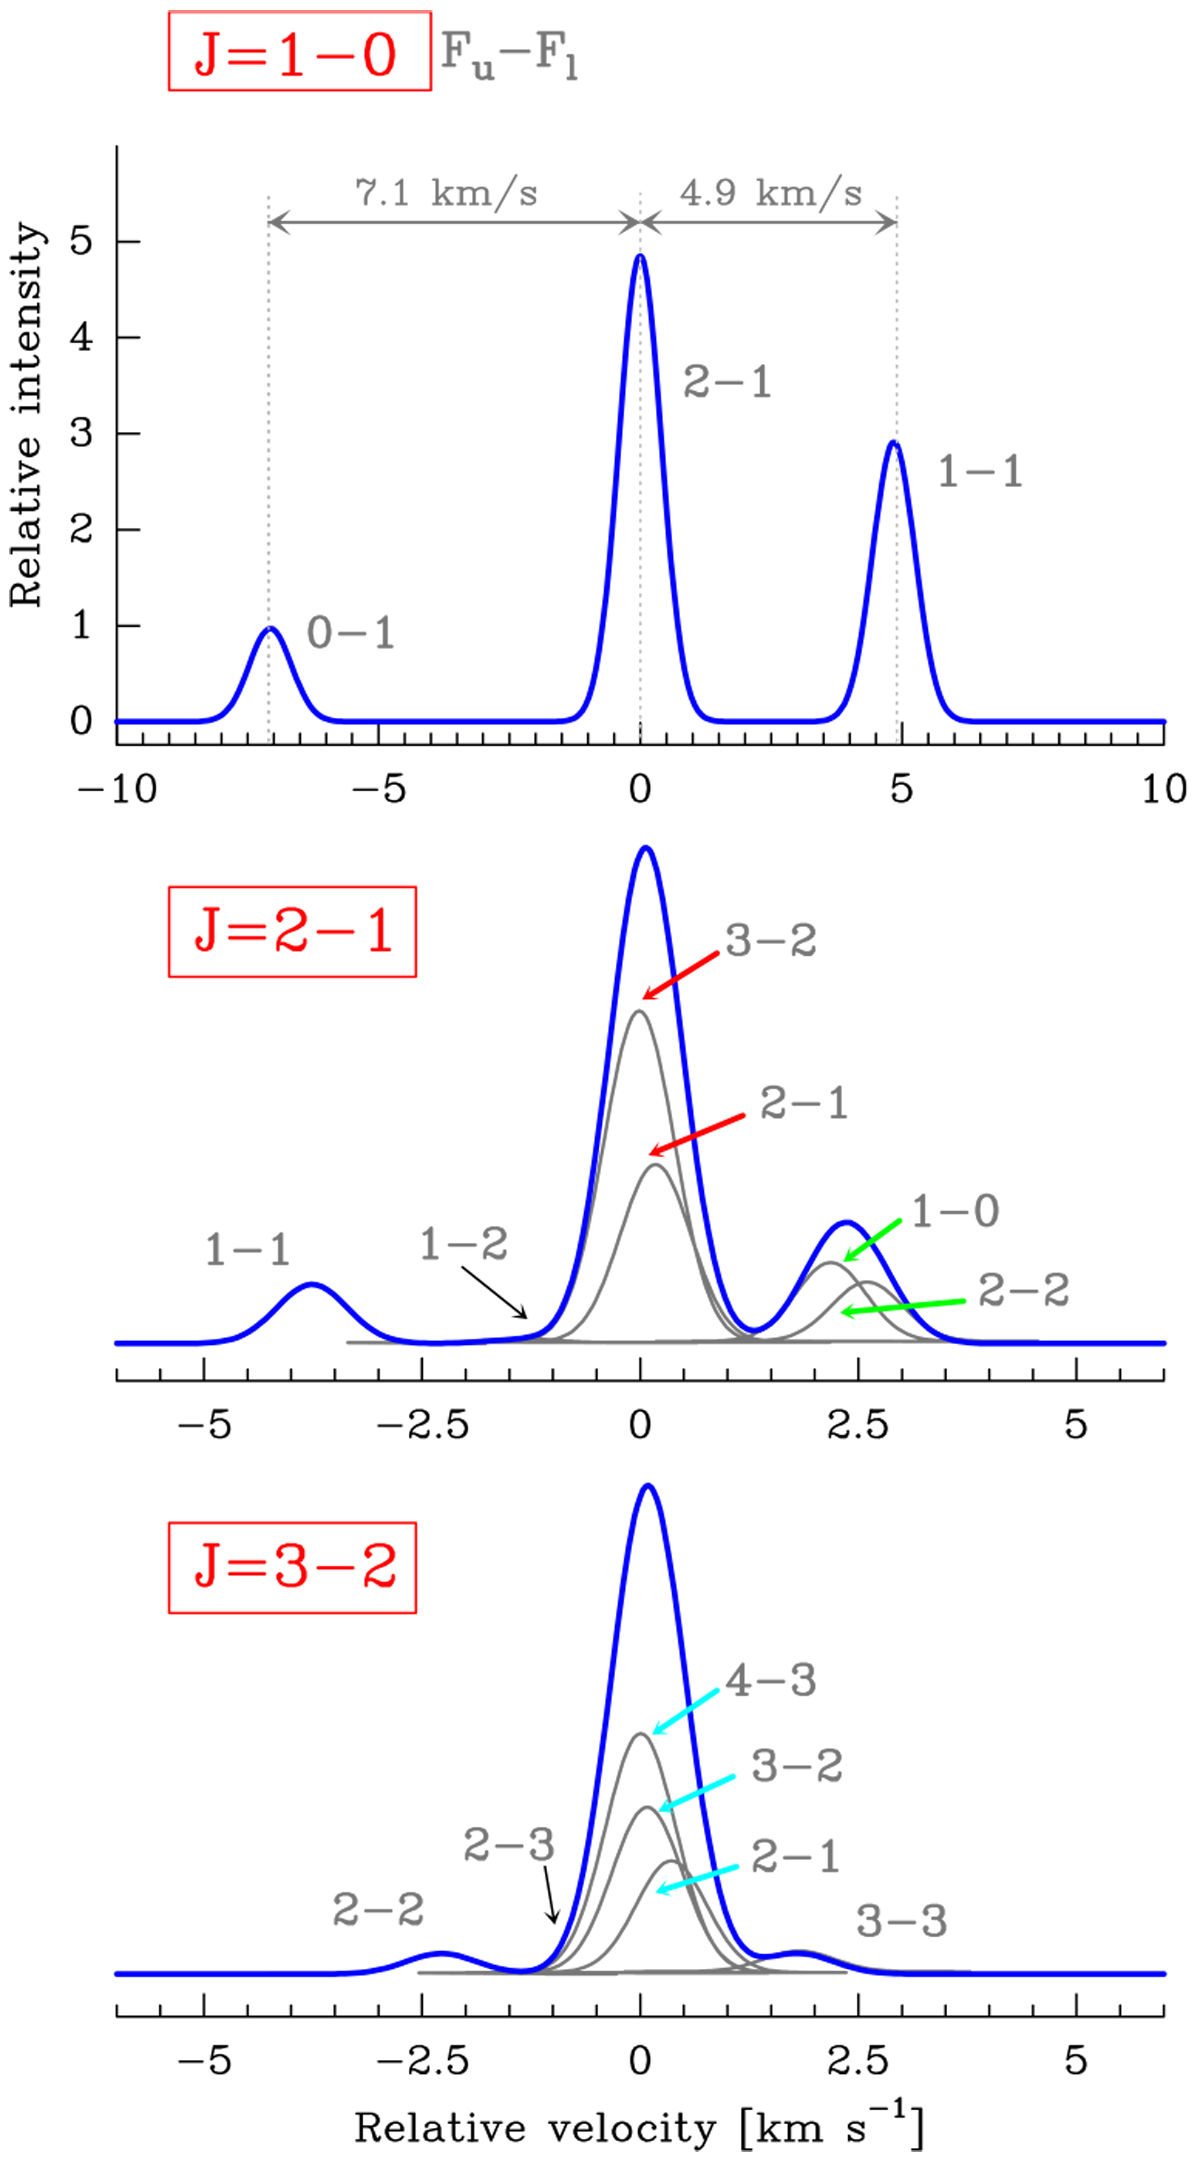
Optically thin HCN J = 1–0 (~88.6 GHz), 2–1 (~177.3 GHz) and 3–2 (~265.9 GHz) spectra for a cloud with Δv ≃ 1 km s−1. Each panel shows the velocity separation from the strongest HFS component. As line opacities increase, line overlaps in the J = 2–1 and 3–2 HFS transitions affect the global excitation of HFS levels. Red, green, and cyan arrows show specific lines that overlap and produce most of the anomalous HFS emission discussed in the text (see also Fig. A.1).
Current usage metrics show cumulative count of Article Views (full-text article views including HTML views, PDF and ePub downloads, according to the available data) and Abstracts Views on Vision4Press platform.
Data correspond to usage on the plateform after 2015. The current usage metrics is available 48-96 hours after online publication and is updated daily on week days.
Initial download of the metrics may take a while.