Fig. 7
Download original image
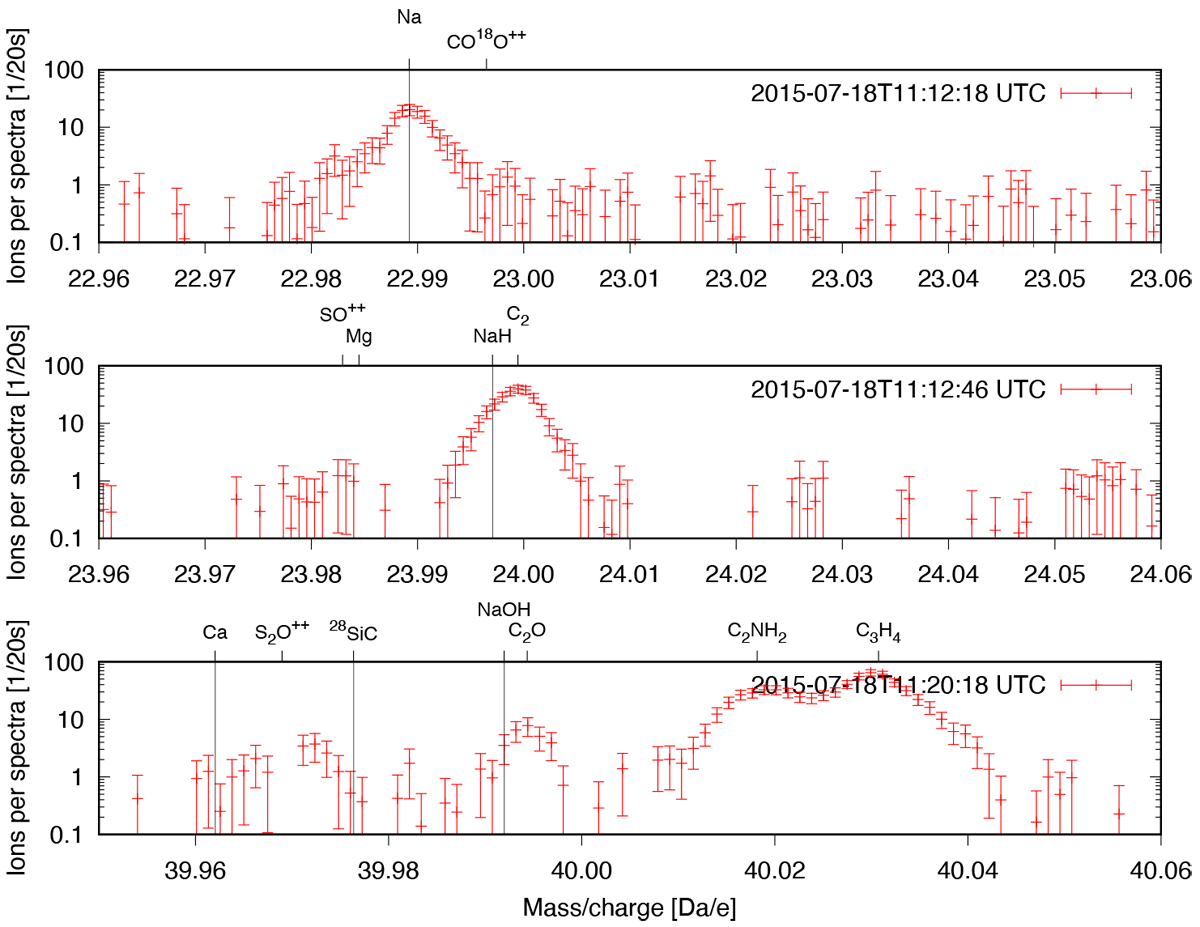
ROSINA DFMS m∕Q = 23, 24, and 40 Da/e spectra measured on 18 July 2015, 11:12:18 (MC_20150718_111051320_M0222.TAB, row B), 11:12:46 (MC_20150718_111119320_M0222.TAB, row B), and 11:20:18 UTC (MC_20150718_111851330_M0222.TAB, row B) top to bottom. Indicated are the masses of a suite of species including Na and where NaH and NaOH would be expected.
Current usage metrics show cumulative count of Article Views (full-text article views including HTML views, PDF and ePub downloads, according to the available data) and Abstracts Views on Vision4Press platform.
Data correspond to usage on the plateform after 2015. The current usage metrics is available 48-96 hours after online publication and is updated daily on week days.
Initial download of the metrics may take a while.