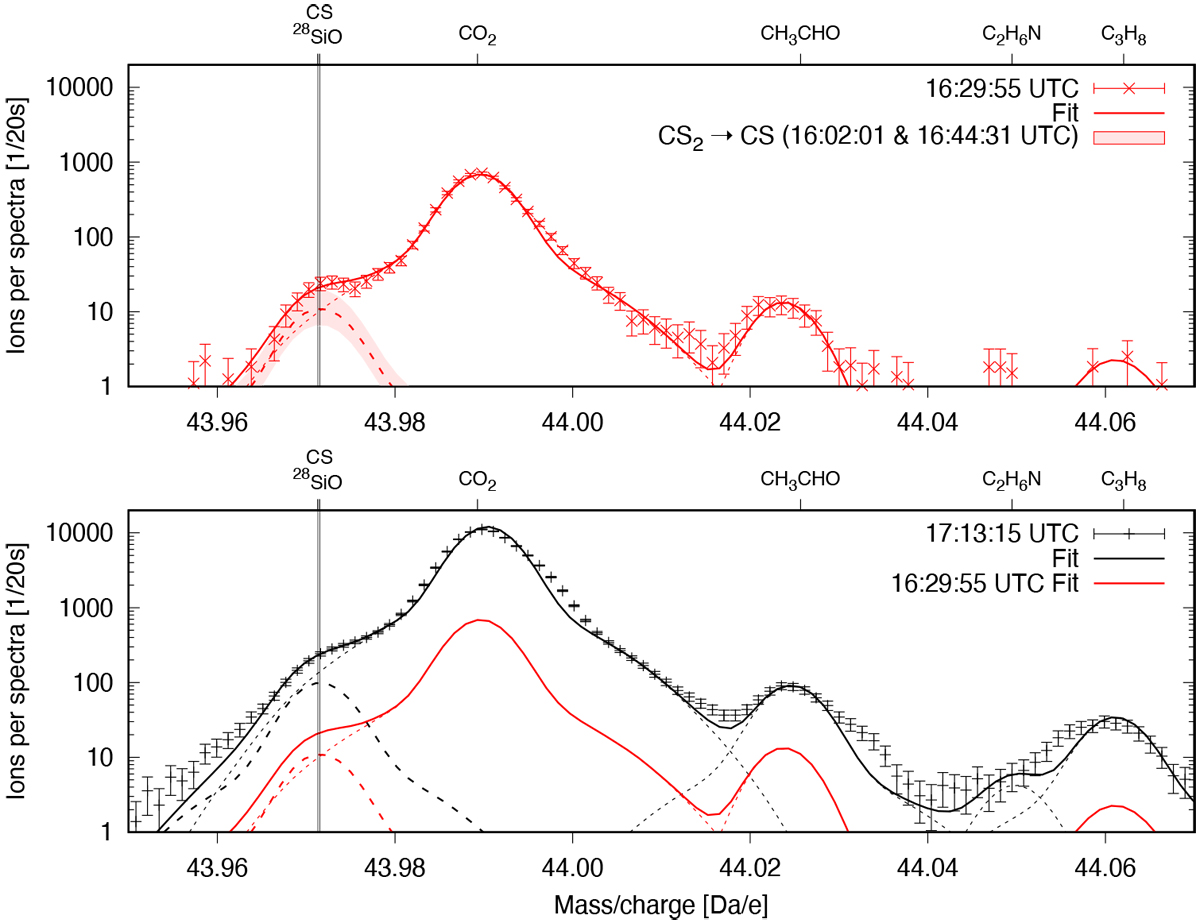
Fig. 4
Download original image
Two ROSINA DFMS m∕Q = 44 Da/e spectra top and bottom, measured on 31 July 2015 during and after the slew, 16:29:55 (MC_20150731_162827570_M0222.TAB, row B) and 17:13:15 UTC (MC_20150731_171147603_M0222.TAB, row B), at off-nadir angles 130 and 19 degrees, respectively. 28SiO and CS cannot be separated and have been fitted as a single peak indicated by the red dashed line (dotted lines: all other species, solid line: sum curve; see Sect. 3 for information on the peak shape). The contribution to CS by fragmentation of cometary parent CS2 → CS is indicated by the red shaded area and may fully account for the measured signal. The bottom panel also contains the sum curve of the upper panel obtained during the slew for comparison.
Current usage metrics show cumulative count of Article Views (full-text article views including HTML views, PDF and ePub downloads, according to the available data) and Abstracts Views on Vision4Press platform.
Data correspond to usage on the plateform after 2015. The current usage metrics is available 48-96 hours after online publication and is updated daily on week days.
Initial download of the metrics may take a while.