Fig. 3
Download original image
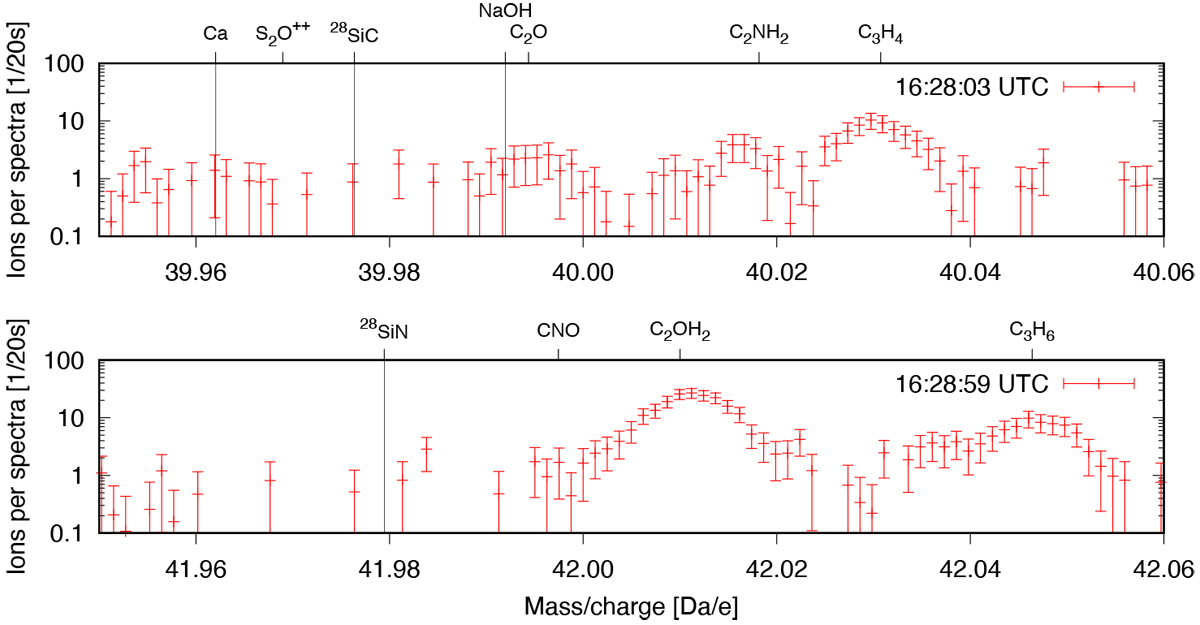
ROSINA DFMS m∕Q = 40 and 42 Da/e spectra top and bottom, measured on 31 July 2015, 16:28:03 (MC_20150731_162635570_M0222.TAB, row B) and 16:28:59 UTC (MC_20150731_162731570_M0222.TAB, row B) during the slew (off-nadir angles 135 and 132 degrees, see Fig. 2). Indicated are the locations where Ca, 28SiC, and 28SiN would be expected.
Current usage metrics show cumulative count of Article Views (full-text article views including HTML views, PDF and ePub downloads, according to the available data) and Abstracts Views on Vision4Press platform.
Data correspond to usage on the plateform after 2015. The current usage metrics is available 48-96 hours after online publication and is updated daily on week days.
Initial download of the metrics may take a while.