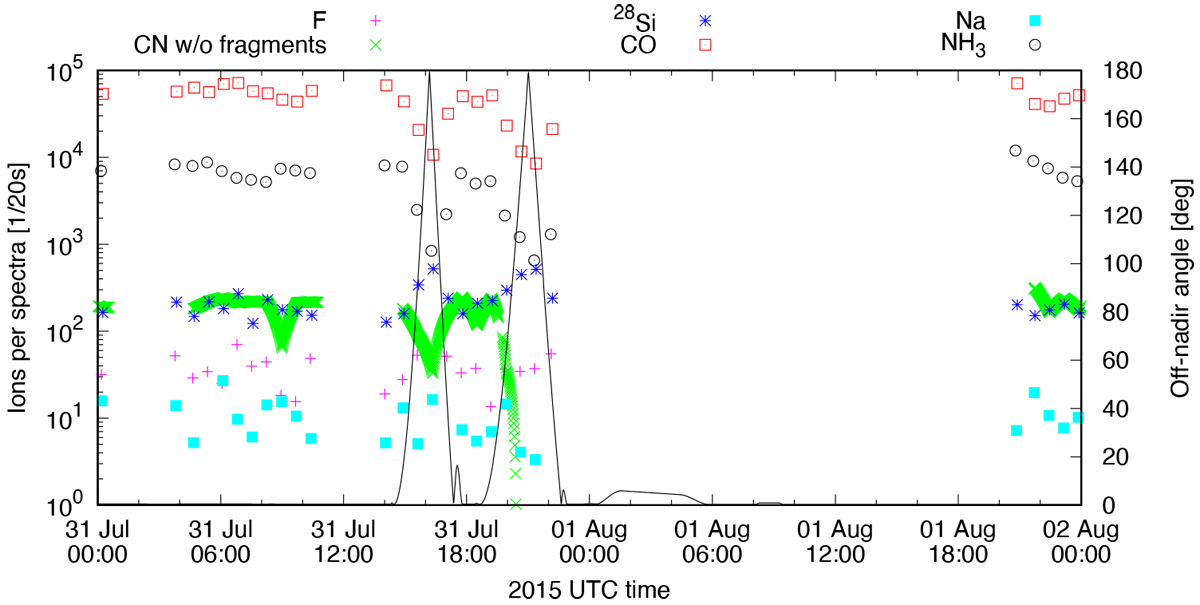
Fig. 2
Download original image
ROSINA DFMS timeline of CO, NH3, CN, F, Na, and 28Si signals (left y-axis), measured between 31 July and 2 August 2015. Fragmentation of HCN → CN has beensubtracted from the CN signal. The solid black line marks the off-nadir angle (right y-axis) including the two great circle scans on 31 July 2015. The cometocentric distance was ~200 km. For most of 1 August 2015 no neutral gas data is available as DFMS was operated in ion mode.
Current usage metrics show cumulative count of Article Views (full-text article views including HTML views, PDF and ePub downloads, according to the available data) and Abstracts Views on Vision4Press platform.
Data correspond to usage on the plateform after 2015. The current usage metrics is available 48-96 hours after online publication and is updated daily on week days.
Initial download of the metrics may take a while.