Fig. 9
Download original image
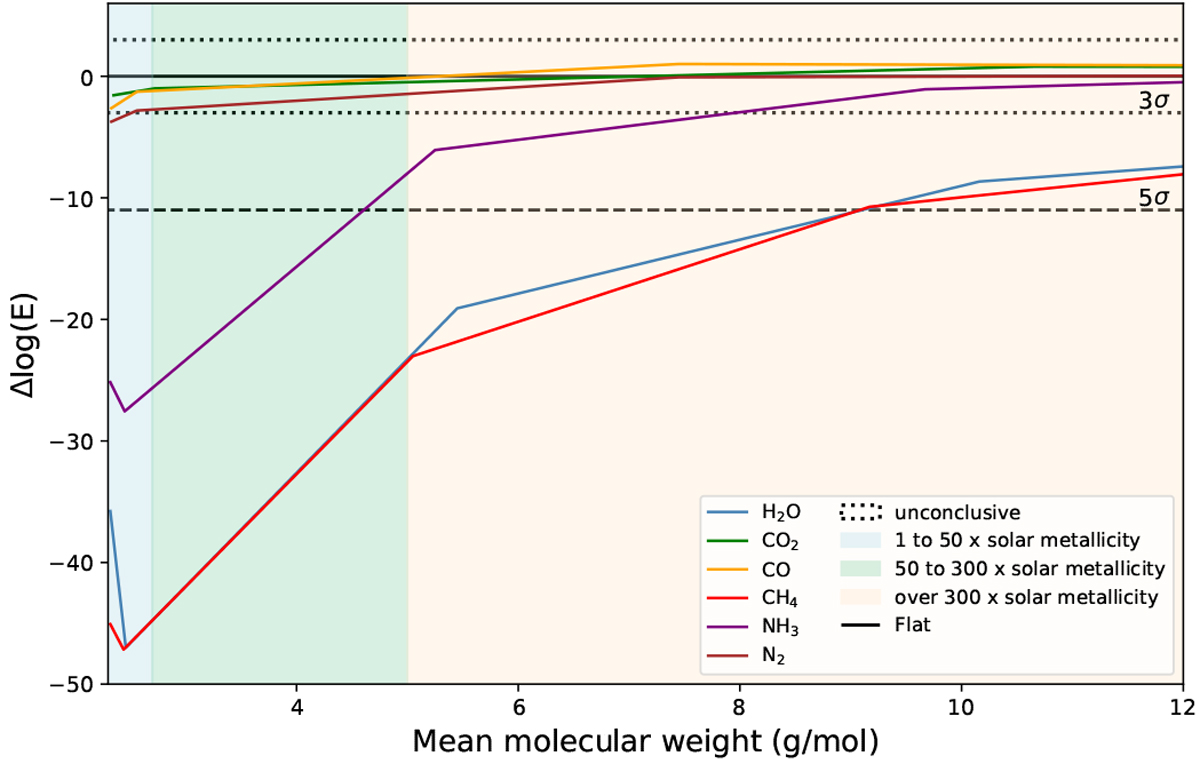
Comparison of the log evidence for a flat line to that of single molecule retrievals where the abundance of the molecule is fixed and no clouds were included. We represent the Delta log(E) with respect to the mean molecular weight of the tested atmospheres. The region between dashes represents the set of Bayes factor values for which it is not possible to conclude compared to a flat line, that is with absolute Δlog(E) below 3. Models below the large dashed lines are strongly disfavoured compared to the flat line.
Current usage metrics show cumulative count of Article Views (full-text article views including HTML views, PDF and ePub downloads, according to the available data) and Abstracts Views on Vision4Press platform.
Data correspond to usage on the plateform after 2015. The current usage metrics is available 48-96 hours after online publication and is updated daily on week days.
Initial download of the metrics may take a while.