Fig. 3
Download original image
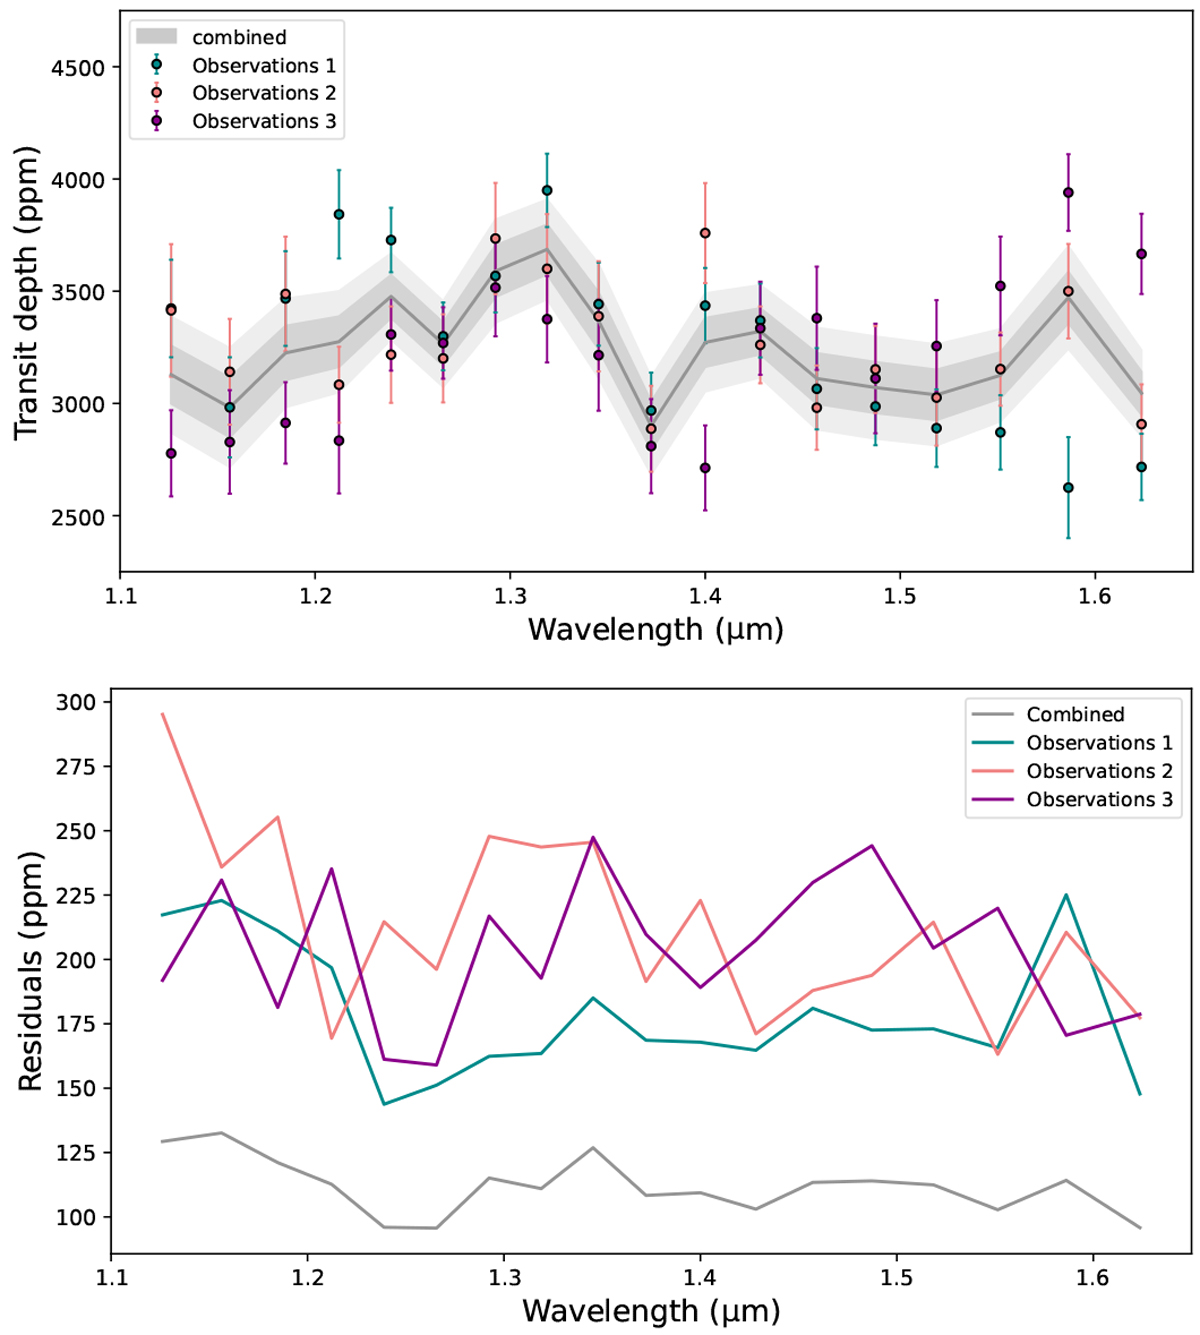
Recovered transit depths for the three observations and combined transmission spectrum with 1 and 2σ uncertainty ranges (top). First, we suppressed the white light curve values from each visit raw flux, then, we computed the weighted mean, and finally we added the mean white light curve value to obtain the transit depth. Residuals are from the spectral light curves analysis and the combined spectrum (bottom).
Current usage metrics show cumulative count of Article Views (full-text article views including HTML views, PDF and ePub downloads, according to the available data) and Abstracts Views on Vision4Press platform.
Data correspond to usage on the plateform after 2015. The current usage metrics is available 48-96 hours after online publication and is updated daily on week days.
Initial download of the metrics may take a while.